to intersections and areas influenced
by geotechnical anomalies.
In regard to the use of the
database, it is generally
recommended that all roadways
driven at a <20˚ angle to the major
horizontal stress should be located
between the Lower Limit or Lower
Design lines and the Regression Line.
Unless precedent indicates otherwise,
all roadways driven at a >20˚ angle to
the major horizontal stress and all
intersections should line between the
Regression Line and the Upper Limit
or Upper Design lines. In the case of
geotechnical anomalies, some
engineering judgment in conjunction
with the use of the database would be
required to arrive at an appropriate
density of roof support.
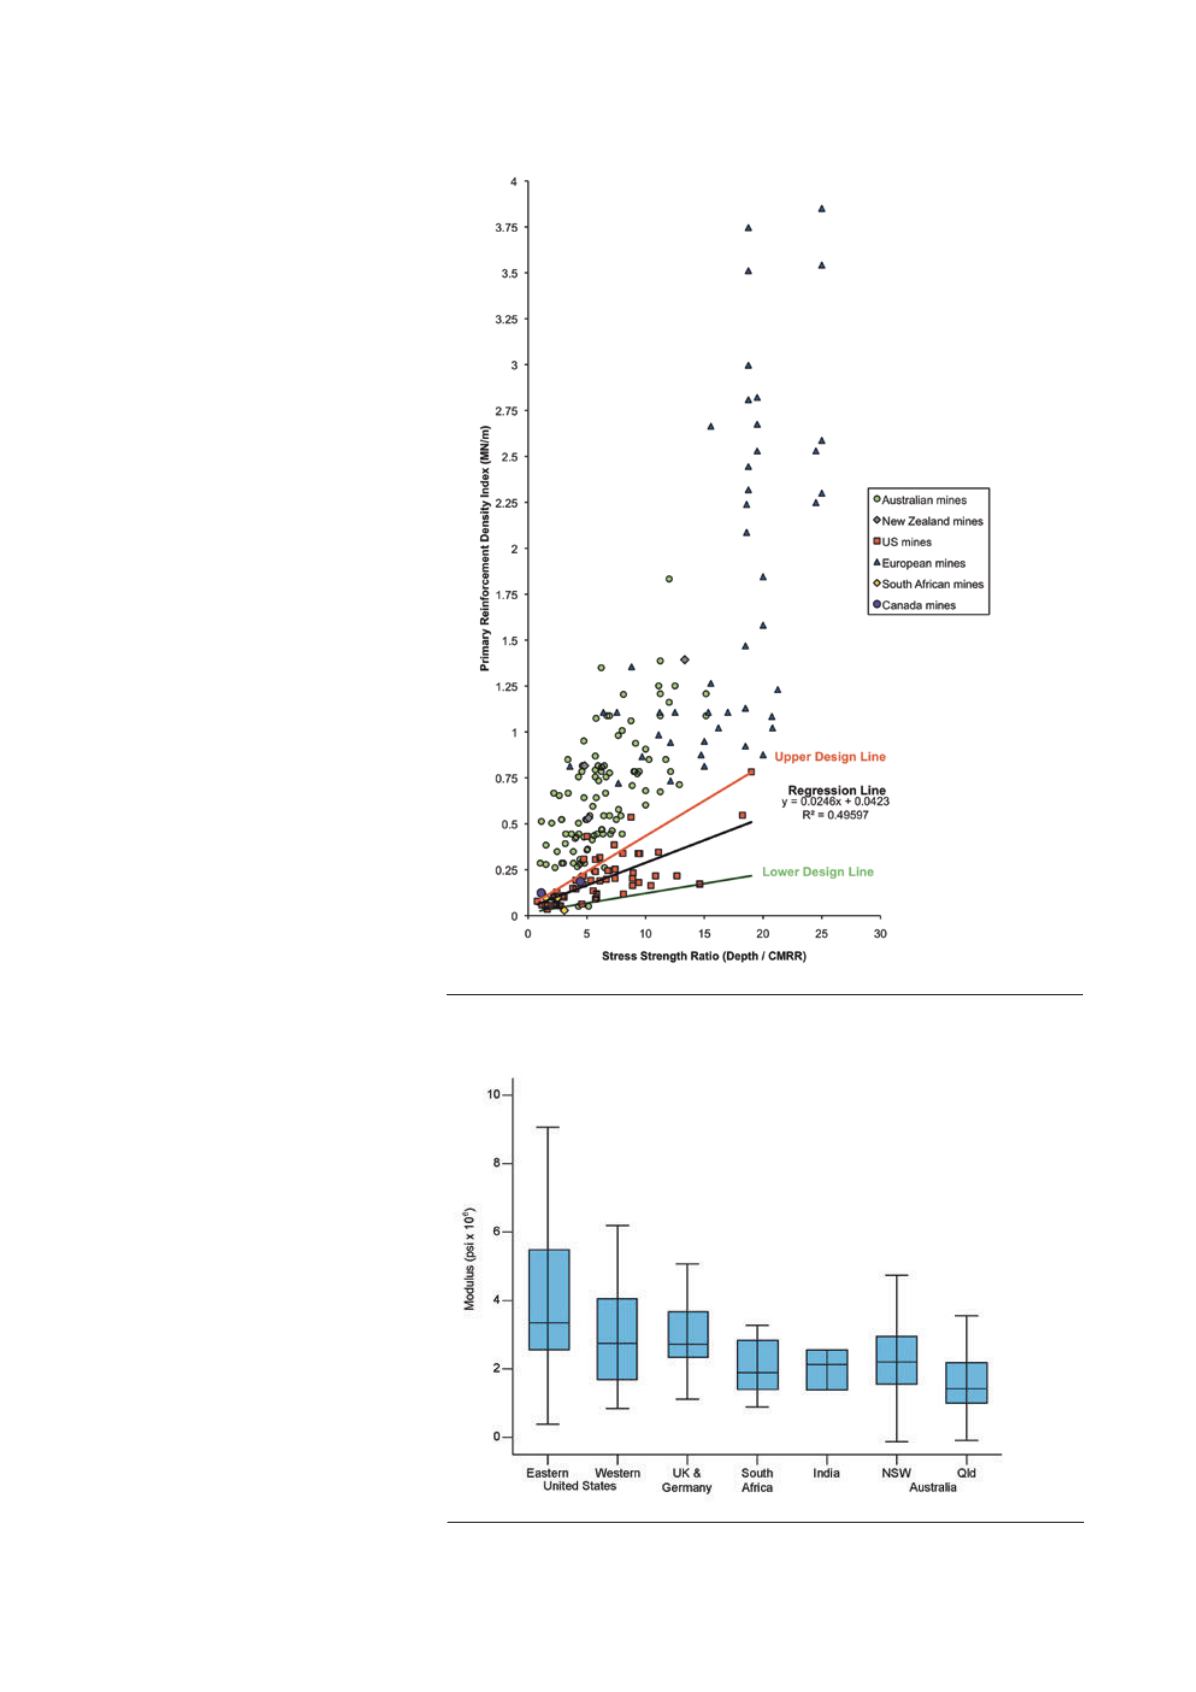
When the US data is added to the
database, a similar trend is evident
(Figure 6). However, when compared
to the world database, the roof is
generally supported with low
densities of roof support over a
similar range of SSRs. The likely
explanation for this trend can be
found in stress measurements, where
the magnitude of the major
horizontal stress is generally lower
when compared to the other coal
producing regions in the database. In
fact, the eastern portion of
North American is classed as a stable
mid-plate region, where the ratio
between the major horizontal stress
and vertical stress is typically
between 1 and 1.6.
7
As shown in
Figure 7, the higher end of this range
is thought to be related to the elastic
modulus of the roof and the resulting
stiff nature of some of the roof strata
found in the eastern US and not the
result of large regional tectonic
stresses found in regions like
Australia, where the ratios can be as
much as 2 to 3. These authors further
indicate that the coalfields in Western
US “fall within regions of extension
or normal faulting, where the vertical
stress is predicted to be greater than
either horizontal stress”.
In terms of roof bolt length, it is no
surprise that the longer bolts used in
the industry are typically installed at
higher SSRs (Figure 8). The database
indicates that above a SSR of 10 in all
Figure 6. Golder's Primary Rib Support Database, including US data.
Figure 7. Plot showing the elastic modulus of the roof in the coal producing regions.
August 2015
|
World Coal
|
87


