As cleat density increases, it is
generally accepted that the overall
competency of the coal decreases.
With everything else being equal, it is
reasonable to assume that the
likelihood of buckling will increase as
cleat spacing decreases, as this would
directly impact the thickness of the
column in Euler’s buckling theory. It
is however important to note that a
statistical analyses carried out by
Colwell concluded that cleat spacing
and cleat density did not have a
significant impact on rib behaviour.
6
The author indicated that this
conclusion was probably related to
the overall strength of the coal, which
appeared to be driven by cleat
density. This therefore suggests that
the average strength of a coal seam
and cleat density are related.
Primary roof support
database
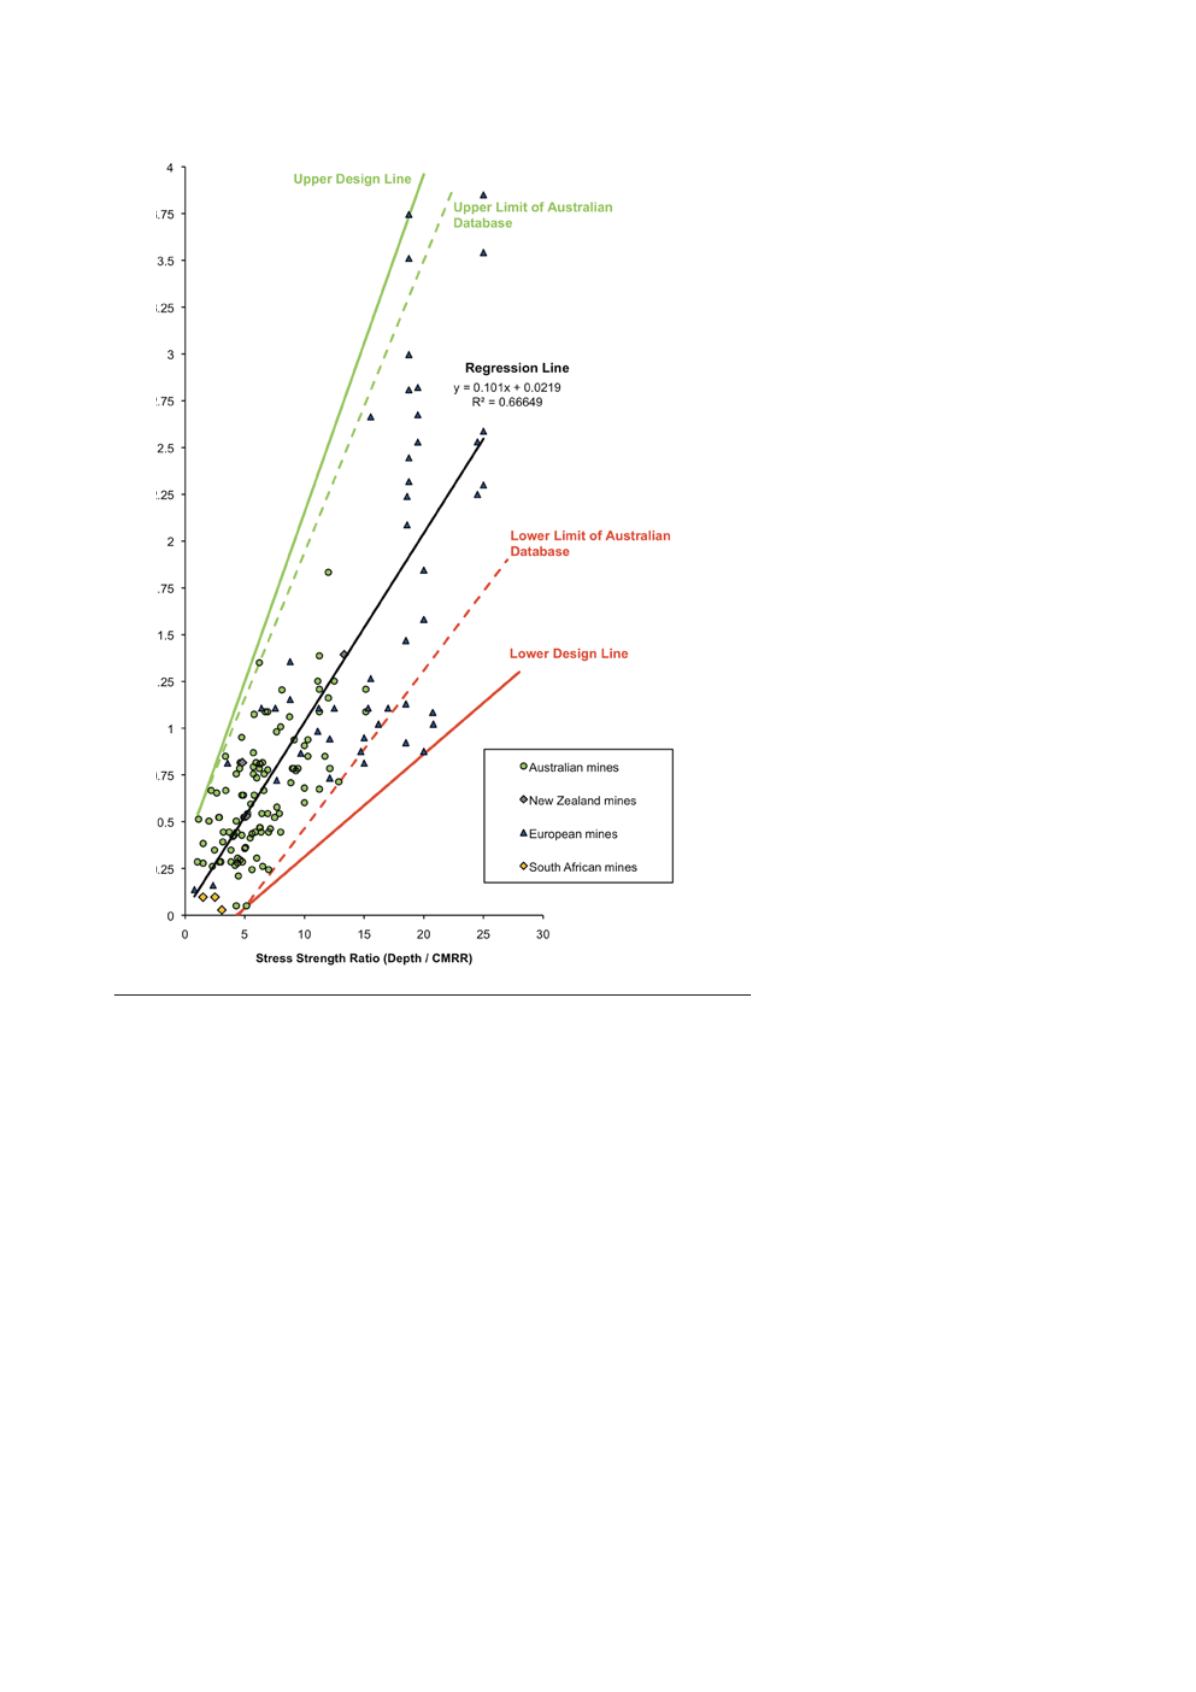
Golder’s Primary Roof Support
Database is developed from
successful primary roof support
designs installed in over 60 mines in
Australia, New Zealand, the UK,
South Africa and Norway (Figure 5).
The mines included in the world
database use similar ground control
methodologies where systematic roof
bolting is utilised.
Analysis of the data indicates that
the major factors influencing
successful roof support designs are
roof competency, which is expressed
as the Coal Mine Roof Rating
(CMRR), and the
in situ
stress. As
roof displacement is essentially a
function of horizontal stress and roof
competency, in order to provide some
form of measure as to the likely
magnitude of roof deformation
during roadway development, the
depth of cover is divided by the
CMRR to arrive at a Stress Strength
Ratio (SSR).
As shown in Figure 5, the primary
Reinforcement Density Index (PRDI)
is captured on the vertical axis. The
PRDI is a measure of the support
capacity and is reported in
meganewtons per metre (MN/m) of
roadway. The inputs into the PRDI
include the axial capacity of the roof
bolt, number of bolts per row and
row spacing, length of installed
bol and roadway width. The PDRIs
in the database range from
0.03 – 3.75 MN/m.
The roadway’s SSR is shown on
the horizontal axis (Figure 5). The
SSR’s in the database range between
0.8 – 25. Depending on the roadway’s
angle of intersection with the major
horizontal stress, a SSR of <5 is often
associated with good roof conditions,
>5 – 11 good to moderate roof
conditions, >11 – 20 moderate to poor
roof conditions and >20 poor to very
poor roof conditions.
The database indicates that as the
roof’s SSR increases, higher densities
of primary roof support are required
to adequately support the roof. This
simply means that a high stressed
and/or weak competency roof
requires more reinforcement to
control buckling, whereas, a low
stressed roof and/or competent roof
does not need to be supported with
large densities of support.
It is possible to define a Regression
Line, as well as a Lower and an
Upper Design Line. The R-squared of
the Regression Line is 0.66, which is
considered to be a reasonable fit to
the dataset. The Lower and Upper
Limit lines shown in Figure 5
effectively delineate the lower and
upper bounds of the Australian
database. Unless there is site
precedent and depending on the
region of the mine in question, these
boundaries are generally used to
define the recommended minimum
and maximum roof support
standards. It should be noted that the
database makes no specific reference
Figure 5. Golder's Primary Roof Support Database.
86
|
World Coal
|
August 2015


