Enormous amounts of chemicals are utilised to clean or keep
paraffin wax in suspension. A new instrument introduced by
Flowrox at the end of 2013 can help many pipeline operators,
offshore rigs and onshore upstream operations. This device
can generate real-time images of the pipeline interior while
the pipe maintains free flow.
This is a major improvement of simply monitoring
flowrate and pressure drop. Numerous factors can cause
flowrate drops in pipelines. For instance, the flowrate may
fall as a pump wears or begins to fail. Pressure drop can occur
if any connection to the main pipeline is opened or if there
are any leaks. The Flowrox Deposition and Flowrox Scaling
Watch can see what is happening in the pipeline without
physically opening the pipeline. With chemical addition, the
Flowrox Deposition Watch can provide real-time feedback on
the effectiveness of the chemicals added. This can be a major
advantage to operators, as well as allowing them to make
better decisions regarding when to disassemble a pipeline for
manual cleaning. They can begin to dose chemicals only when
required and the savings on scaling and deposition chemicals
can be extreme. Also, chemical mix can be tailored more
easily because visual feedback can be provided in real-time.
This instrument is installed in the pipeline similar to a
spool piece and is mated between two flanges. The inner
diameter of the instrument is the identical diameter of the
mating pipeline and has nothing internal that protrudes into
the flow stream.
Electrical capacitance tomography
Flowrox Deposition Watch utilises electrical capacitance
tomography (ECT) to create real-time images of the inside
of the piping and to detect the differences in permittivity
of the various substances found in the piping system. The
fundamental principle in tomography is to expose the target
of interest to an appropriate stimulus and then measure the
response that depends on the material properties within the
target volume. Very low voltages, usually 3 - 12 V, are delivered
to electrodes that surround the instrument. Capacitance
measurements are received back from the instrument. Special
algorithms are then used to find an estimate for the actual
material property distribution that creates a 3D image of the
process fluid in the piping, and generates trend data as well as
show free volume inside the pipe and the growth rate of the
deposition growth over time.
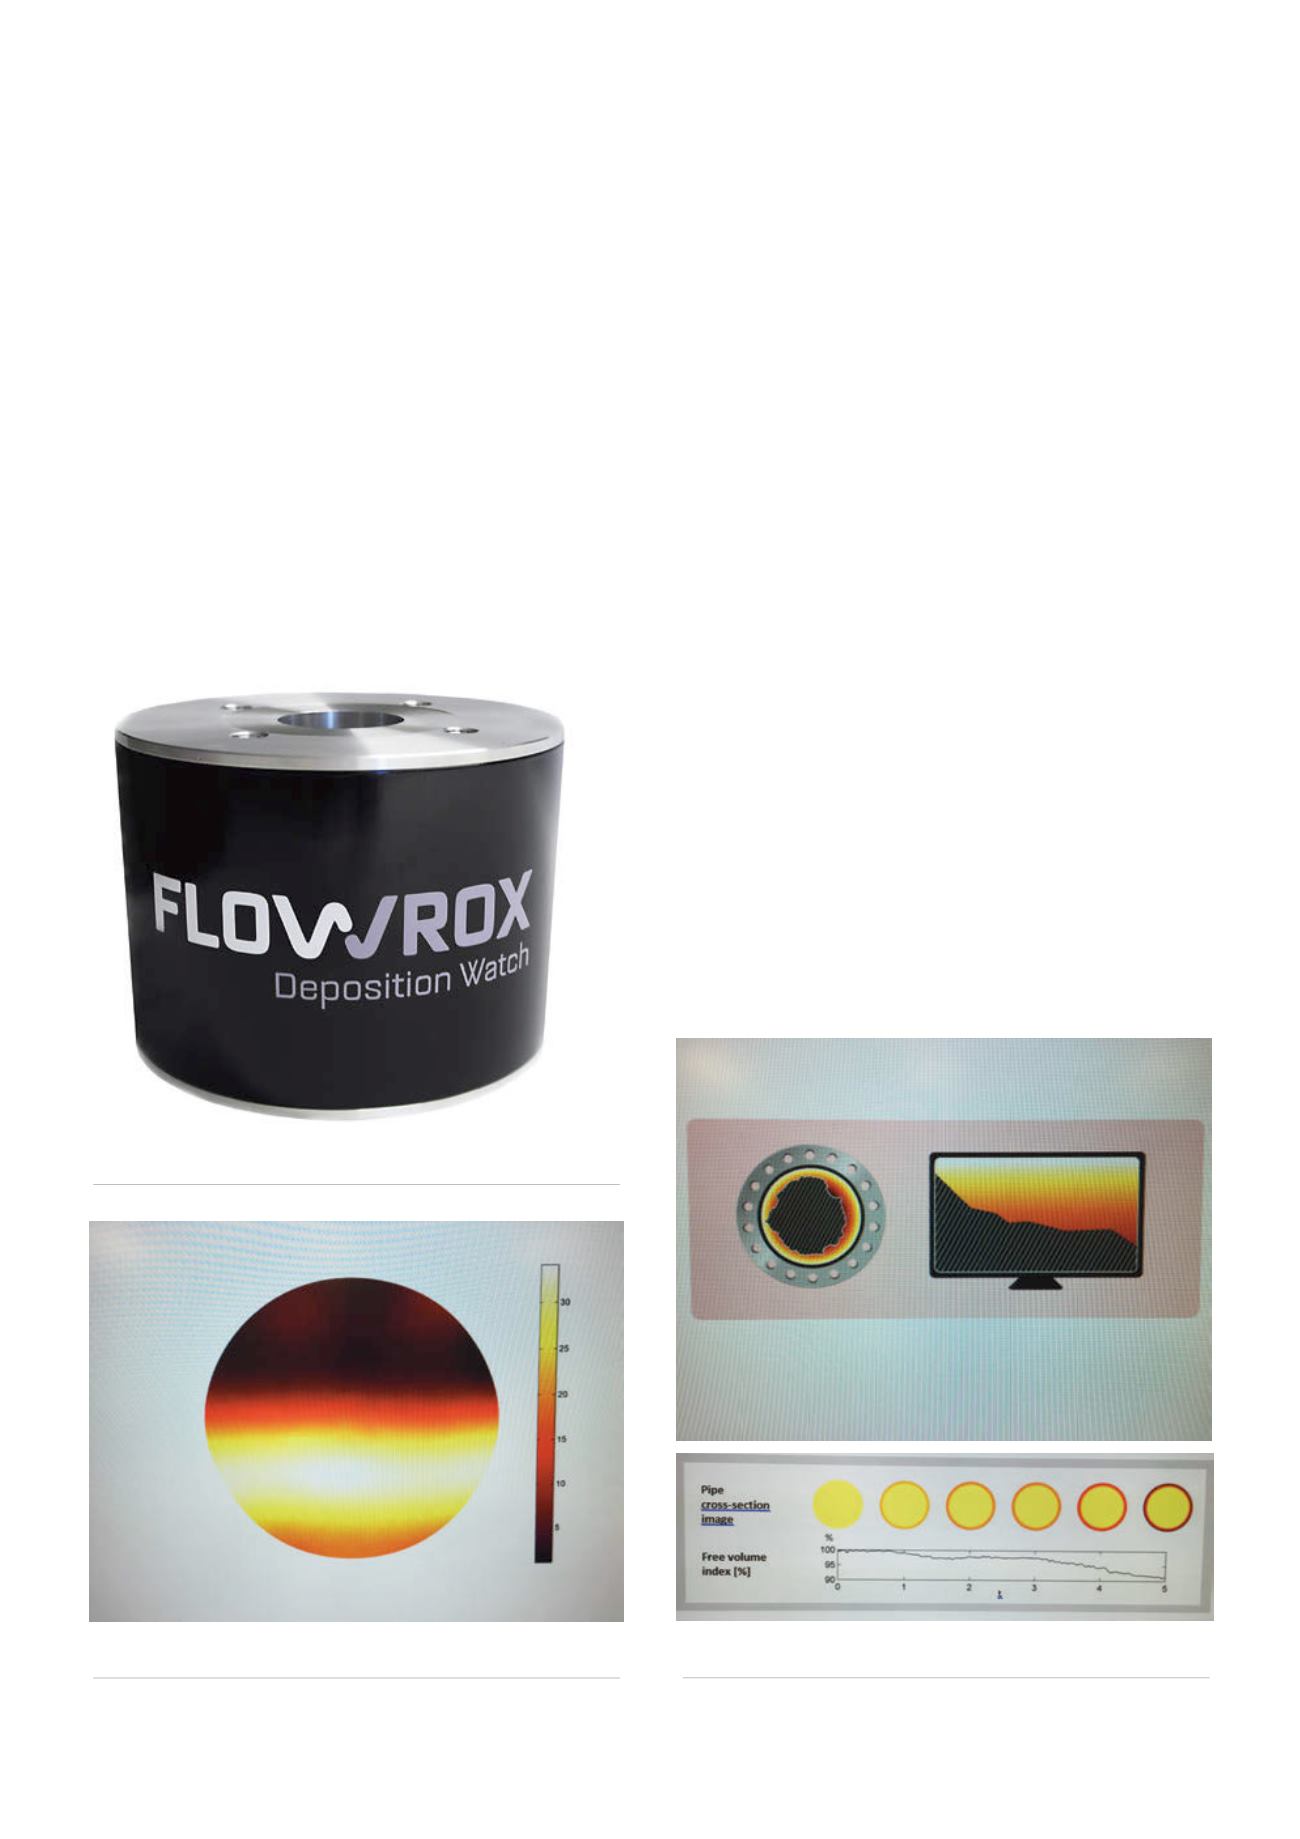
Another patent pending feature is the ability to not only
provide deposition growth, but also provide multiphase
flow visualisation to create visual images of stratified
flow. For instance, if the bottom of the pipeline has 10%
Figure 3.
Flowrox Deposition Watch for monitoring paraffin
wax deposits or other types of hard scale.
Figure 4.
Stratified flow of 50% oil top, 40% water middle,
10% sand bottom.
Figure 5.
Flowrox Deposition Watch provides the growth rate
of scale or deposits over time as well as the free volume index.
98
World Pipelines
/
JUNE 2015


