Q
&
A
Flow
Endress+Hauser, USA
Use of SCADA systems, flow data
Outside industry influence is beginning to take hold on current
pipeline process management in the presentation of flow ‘data’,
better referred to as the window into a process, with new
‘information’.
As meter technology improves, customers have proactive
ways to diagnose pipeline process conditions, fluid changes,
surveil flowmeter health or detect pipeline process impacts from
upstream events.
Flow technologies are routinely expected to produce a
constant measurement performance. New advances have
streamlined the diagnostics information into simple remedy based
solutions, designed to proactively drive an operational response.
Emerging standards created by NAMUR within the chemical
industry can be applied to pipelines, too. Event notifications from
new generation flow devices can now provide a change of device
status within the SCADA environment for operations to use. This
has the potential to drive operational and service efficiencies
while minimising pipeline losses.
Flowmeter technology, selecting a
flow measurement tool
Web based solutions for flowmeter selection and sizing have
evolved, giving users access to multiple technologies where they
can evaluate ‘best fit’ flowsensors for a given application. While
pipeline flow capacities, pressure loss and uncertainty calculations
drive most meter selections, many new programmes have the
ability to match multiple meters and address viscosity ranges,
mass and volume characteristics, corrected volume capabilities,
Reynolds number suitability, multiple process temperatures or
densities – to give insight into multiple technologies.
Further selection parameters can be industry specific, related
to material options, flange options, housing options (either
compact or remote), output options, hazardous area requirements
and the associated approvals needed for installation conformance.
Further criteria can narrow the selection to performance options
needed for custody transfer security, customised density outputs
to meet industry requirements, added digital and analogue output
options designed to help a novice or experienced user define the
right technology. As a benefit to users, this has evolved to other
key technologies often used by pipeline customers and can be
employed for their benefit (for example, pressure, temperature,
level or analytical devices).
Diagnosing meter performance
Meter performance has often relied upon intuition, experience
or obscure parameters rather than a fact based solution with
inherent redundancy. Diagnosing meter performance has evolved
significantly during the past 10 years – so much so that customers
can use meter diagnostics proactively to minimise maintenance
and drive operational excellence.
The most common requirements are routinely satisfied,
like offline status or device failure. With the advent of onboard
traceable and accredited means of verification, defining meter
performance to the original design specification of a manufacturer
is now possible. Built in subroutines analyse the device health
constantly; in-situ techniques are now recognised by industry
leading third parties for their inherent capability to define meter
health, safety and measurement quality.
Diagnosis of sensory integrity, process upset, process out
of specification and integration issues, are common systematic
failures. Applying evolutionary concepts in sensor and transmitter
design has enabled improvements in flowmeter diagnosis. This
is clearly evident in the diagnostic coverage level, safe failure
fraction analysis and diagnosis of dangerous undetected faults.
These new concepts provide complete transmitter to sensor
to output signal coverage with previously unattained reliability.
This reliability is backed up by compliance to the relevant
requirements of international standards.
Viscosity and flow assurance
Pipeline flow measurement is often challenged with the variability
of liquids related to viscosity change. This can be attributed to
producer product fluctuations or the impact of changing process
or seasonal temperatures variations. Viscosity changes can directly
impact meter factor changes, resulting repeatability and accuracy
Figure 1.
Application selector screen for picking flowmeters.
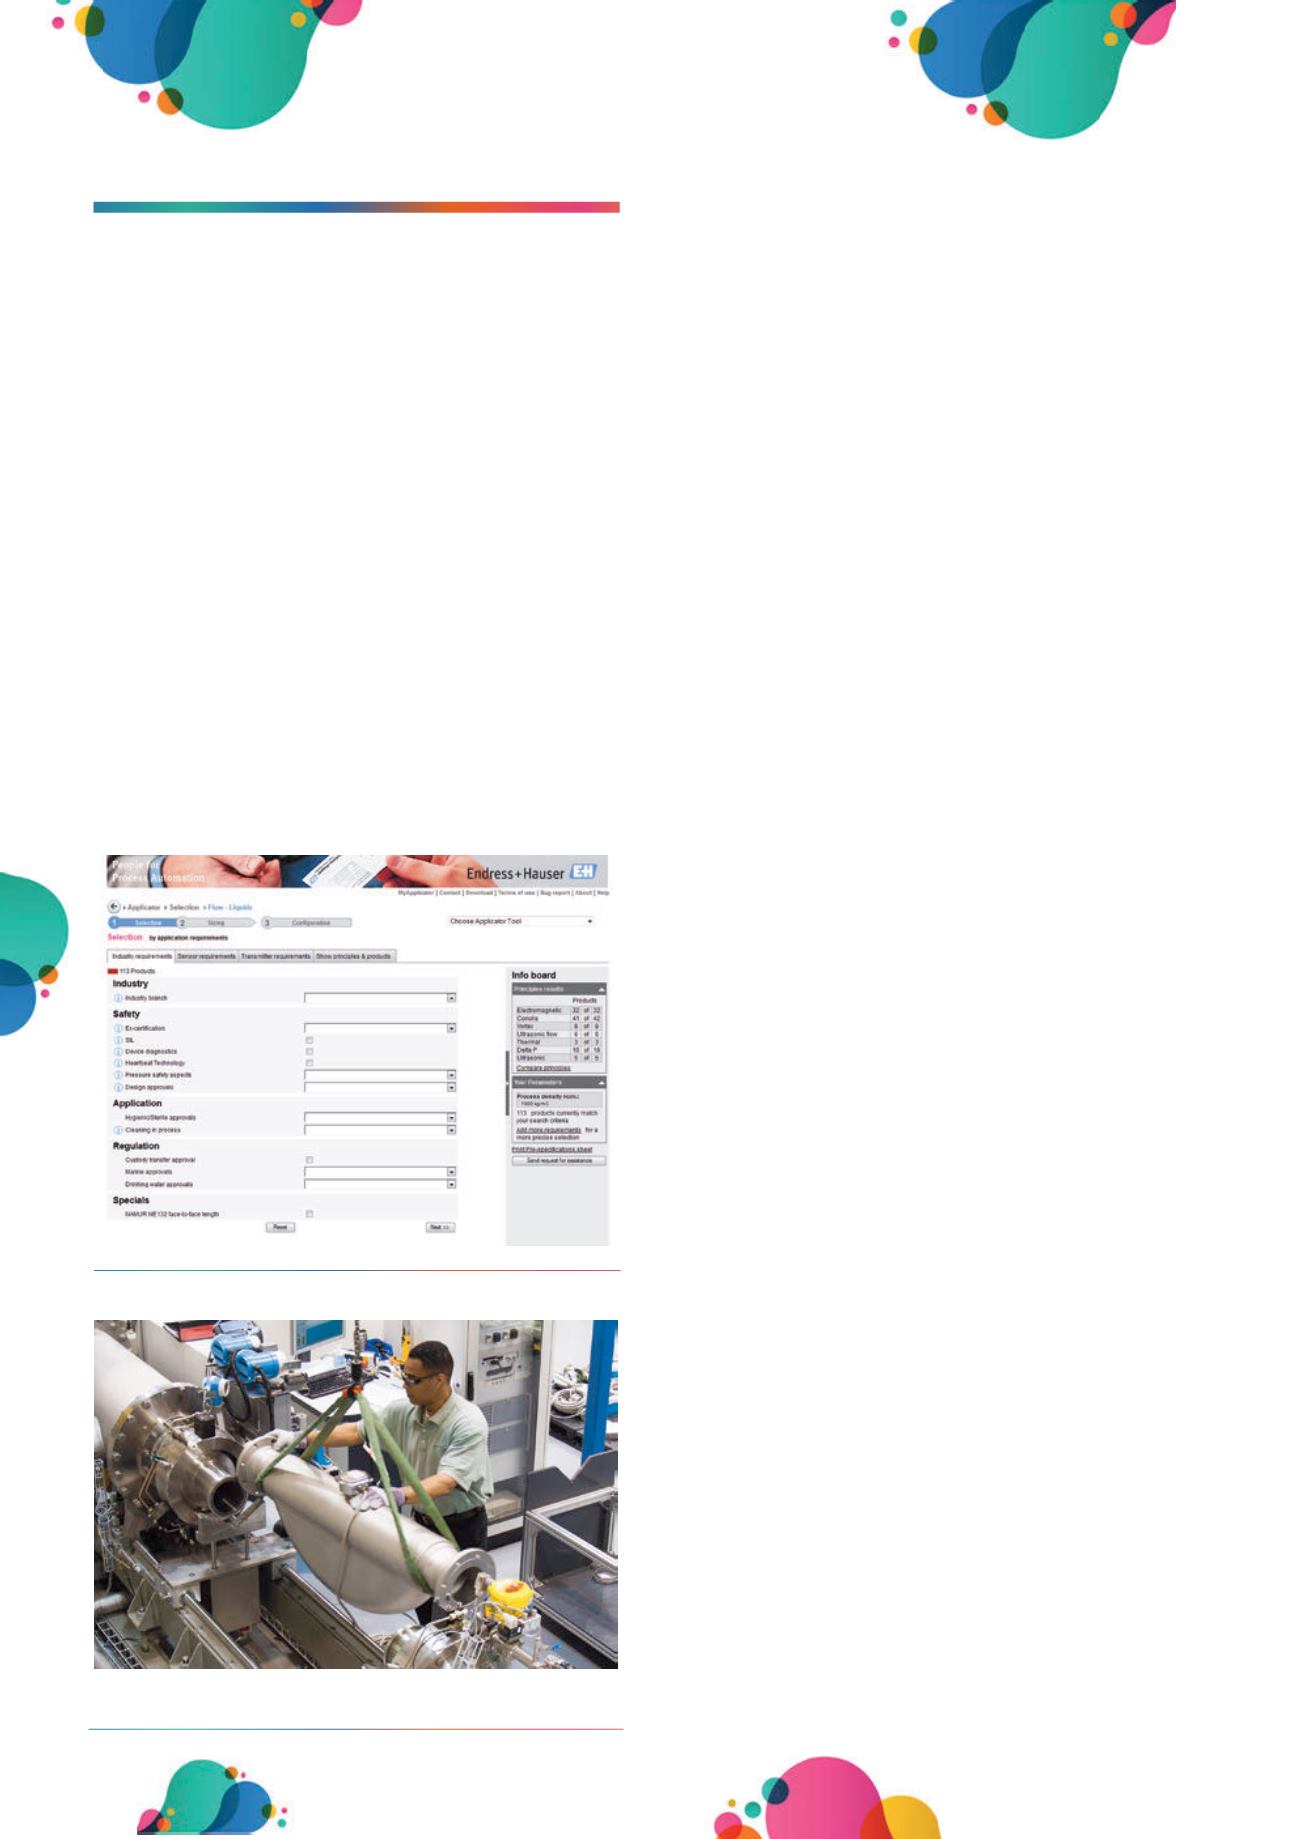
Figure 2.
A calibration rig with a Coriolis flowmeter about to be
tested and calibrated in an Endress+Hauser flow laboratory.
88


