demand for the ILI technologies to provide a higher quality
of data increases as well.
High-resolution MFL technology tools
As with everything, the more accurate data available, the
better the decisions that can be made. With the right
data, operators can reduce downtime, lost revenue and
maintenance costs, as well as lower digging occurrences
and health, safety and environmental (HSE) risks. High-
resolution ILI tools provide a detailed insight into the
immediate, potential and future integrity threats a pipeline
faces.
The term ‘high-resolution tool’ was coined in the mid-
1980s when the industry migrated from its first generation
of ILI tools into subsequent generations. However, the
definition of a high-resolution tool has changed as new
ILI technologies are introduced that provide pipeline
operators with better, clearer pipeline integrity data. As
with all technology, what was considered high-resolution
10 years ago pales in comparison to the tools of today.
Resolution is measured in the industry today by
the axial sample rate (how often the tool measures the
magnetic flux), and the number and spacing of sensors
circumferentially (how many sensors are on a tool and
how far apart they are spaced). The more sensors packed
tightly together that sample more frequently, the higher
the resolution. This generates a performance specification
for the tool type with regard to the type and size of
anomalies it can detect and size.
The most common high-resolution ILI technology
used today for detection of metal loss is magnetic flux
leakage (MFL). With this method, the tool saturates the
pipeline wall with magnetism, which leaks out in areas of
wall thickness reduction such as metal loss. The leakage is
detected by sensors on the tool, and the collected data is
saved on the tool to be analysed after the tool run.
The earliest MFL tools collected data through
inductive coils, which over time have, for the most part,
been replaced by more accurate, smaller, and more
rugged Hall-effect sensors. Better sensors have developed
over time due to the availability of semiconductor
material, decreases in circuitry space requirements,
and improved techniques to mount the sensors. A Hall
sensor will measure the magnetic flux leakage vector
perpendicular to its surface in order to collect the
best available information. Three Hall sensors can be
constructed to measure radial flux leakage out of the pipe,
axial flux parallel to the pipe wall, and the flux leaking
circumferentially around the pipe.
These triaxial sensor configurations have been available
to the market through Baker Hughes since the late 1990s.
They give the vendor the three critical vectors of the
flux leakage signal; this, in turn, allows for more accurate
sizing of the anomaly length, depth and width. Combining
this three axis configuration with an axial sample rate
to provide data points every 0.079 in. (2 mm) gives the
operator detailed data regarding the anomalies of the pipe
wall.
Data collection and analysing
Large amounts of data are collected, converted, and
analysed to determine the pipeline condition. The
amount of data available depends on the resolution of
the tool (as mentioned above, the resolution is measured
by the axial sample rate and the number and spacing of
sensors circumferentially). For example, if an inspection
tool samples a pipeline 31 miles (50 km) long at the
0.079 in. (2 mm) axial sample rate and has 100 sensors, it
will collect 2.5 billion data points during that tool run.
Just like in digital photography where more pixels equal a
better picture, the more data points there are along the
pipe wall, the more accurate the representation of the
pipeline condition the operator gets.
The Baker Hughes VECTRA™ and GEMINI™ MFL tools use
a sensor head that contains nine Hall sensors (three sets
of axial, radial, and circumferential Hall-sensor triads). A
30 in. dia. tool will have 210 Hall sensors per orientation,
or 630 Hall sensors for measurement of flux leakage. With
a standard pipe wall, the sensors will have approximately
0.4 in. (11 mm) between each Hall-sensor triad.
Once the inspection run is complete, the data is
collected and analysed within specialised vendor software.
Highly skilled analysts review and convert the collected
Table 1. VECTRA
TM
SENSOR7 specs
Defect depth
+/-7% at 80% confidence
Defect length
+/-6 mm at 80% confidence
Defect width
+/-9 mm at 80% confidence
Probability of detection
97%
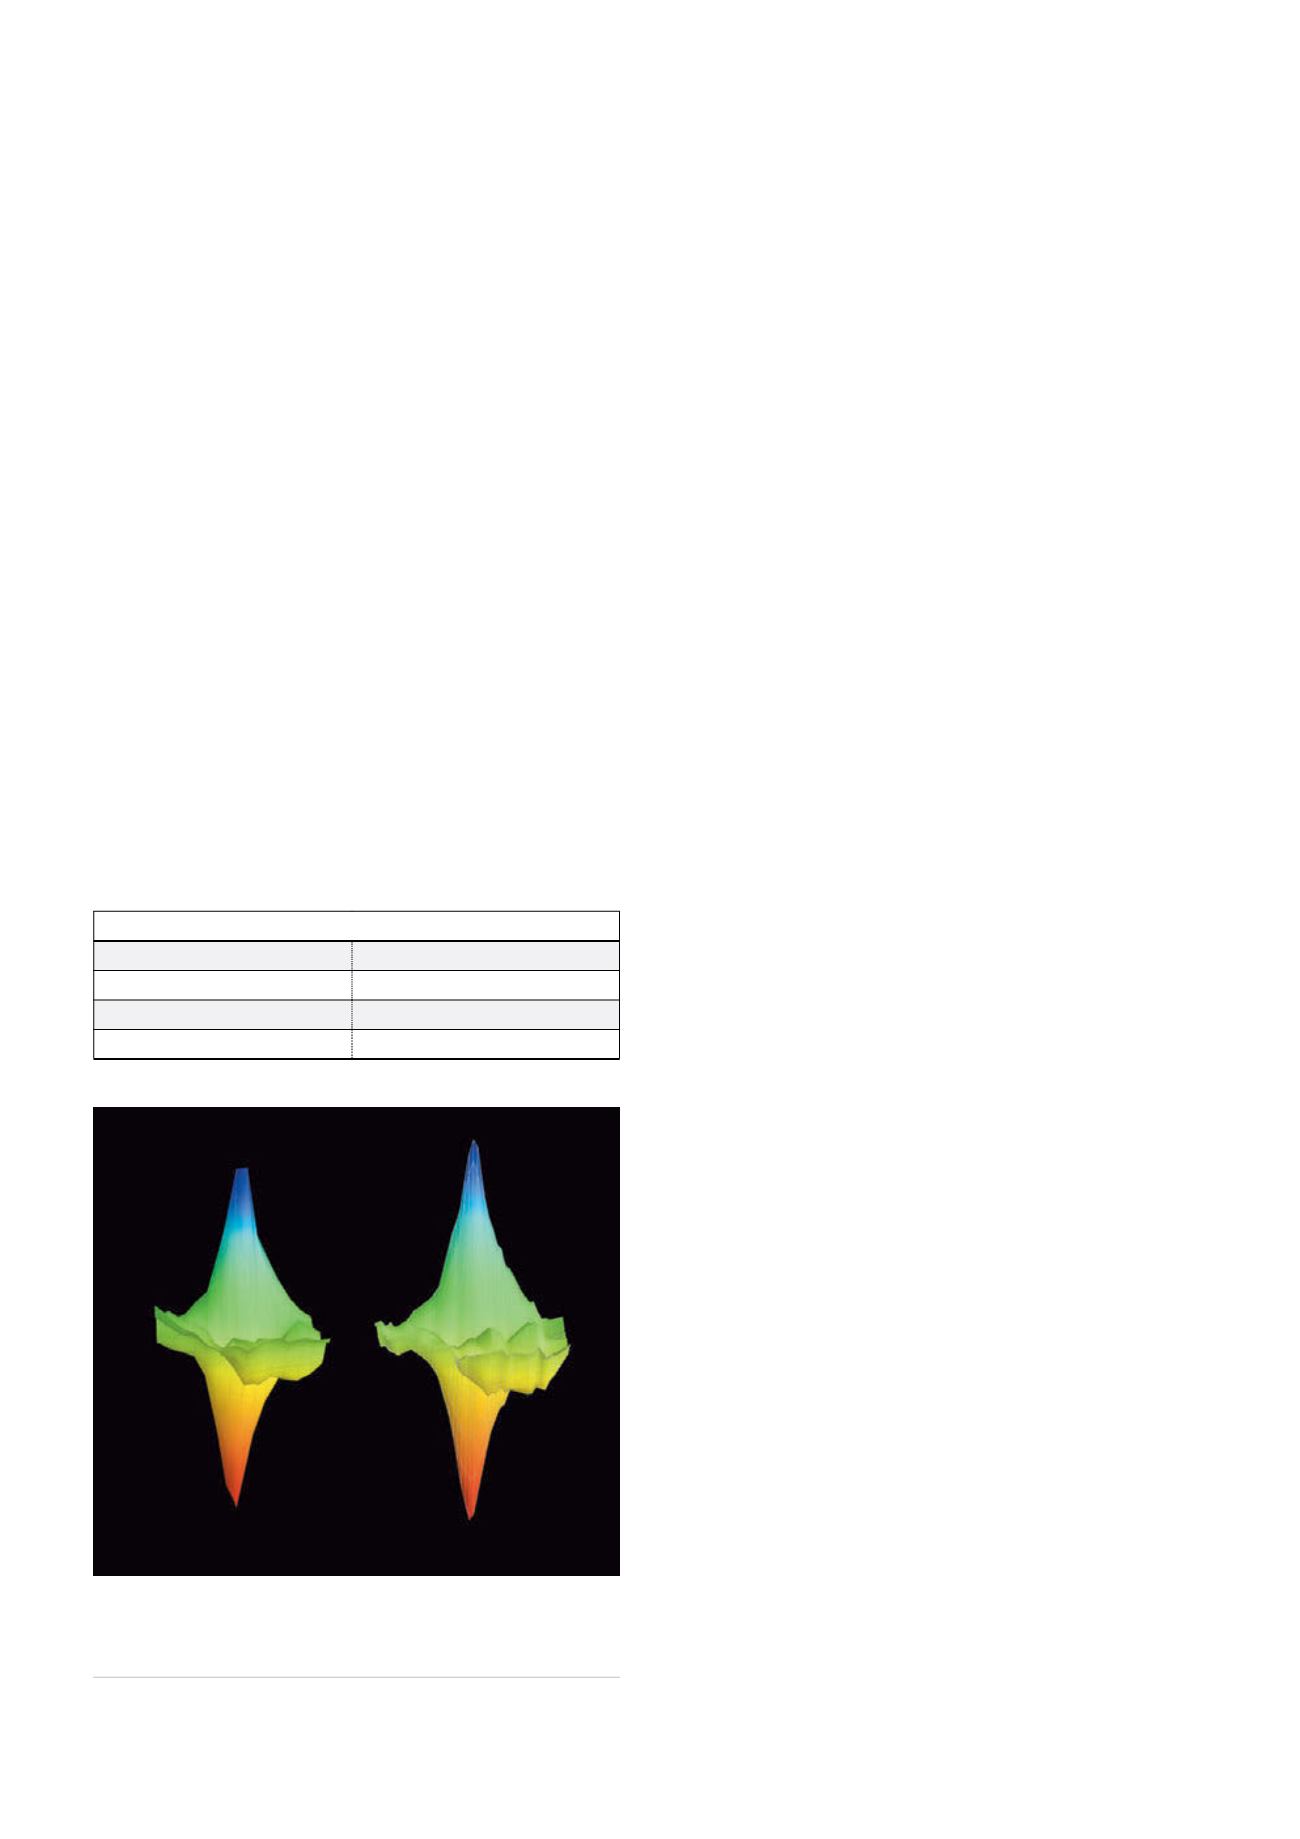
Figure 1.
Data from VECTRA™ SENSOR7 enhanced inline
inspection services (right) shows more detail than a lower
resolution tool, allowing operators to make better informed
decisions regarding digging and repairs.
40
World Pipelines
/
JANUARY 2015


