release from within a pipeline system, the consequences can
be minimised by:
)
)
Reducing the time required for detection of the release.
)
)
Reducing the time required to locate the release.
)
)
Reducing the volume that can be released.
)
)
Reducing the emergency response time.
The volume of an unintended release depends on the
leak rate and the length of time before the leak is detected,
with the leak rate in turn primarily dependent on the pipeline
pressure and defect hole size. In order to determine the
impact that any leak detection technology would have on
limiting the spill size, some understanding of the leak rate
distribution would be required. Unfortunately, the majority
of the release data catalogued in North America only
captures the total release volume (such as the PHMSA dataset
discussed earlier). To circumvent this problem, a methodology
and dataset published by Det Norske Veritas, Norway, (DNV)
was applied that provides the hole size distribution for
hydrocarbon equipment including pipelines.
From this data,
3
it can be derived that leaks
caused by smaller diameter holes occur
much more frequently than leaks due to
larger holes. Intuitively this makes sense as
corrosion processes are not likely to result
in a very large diameter hole instantaneously
but rather allow a hole to grow in size over
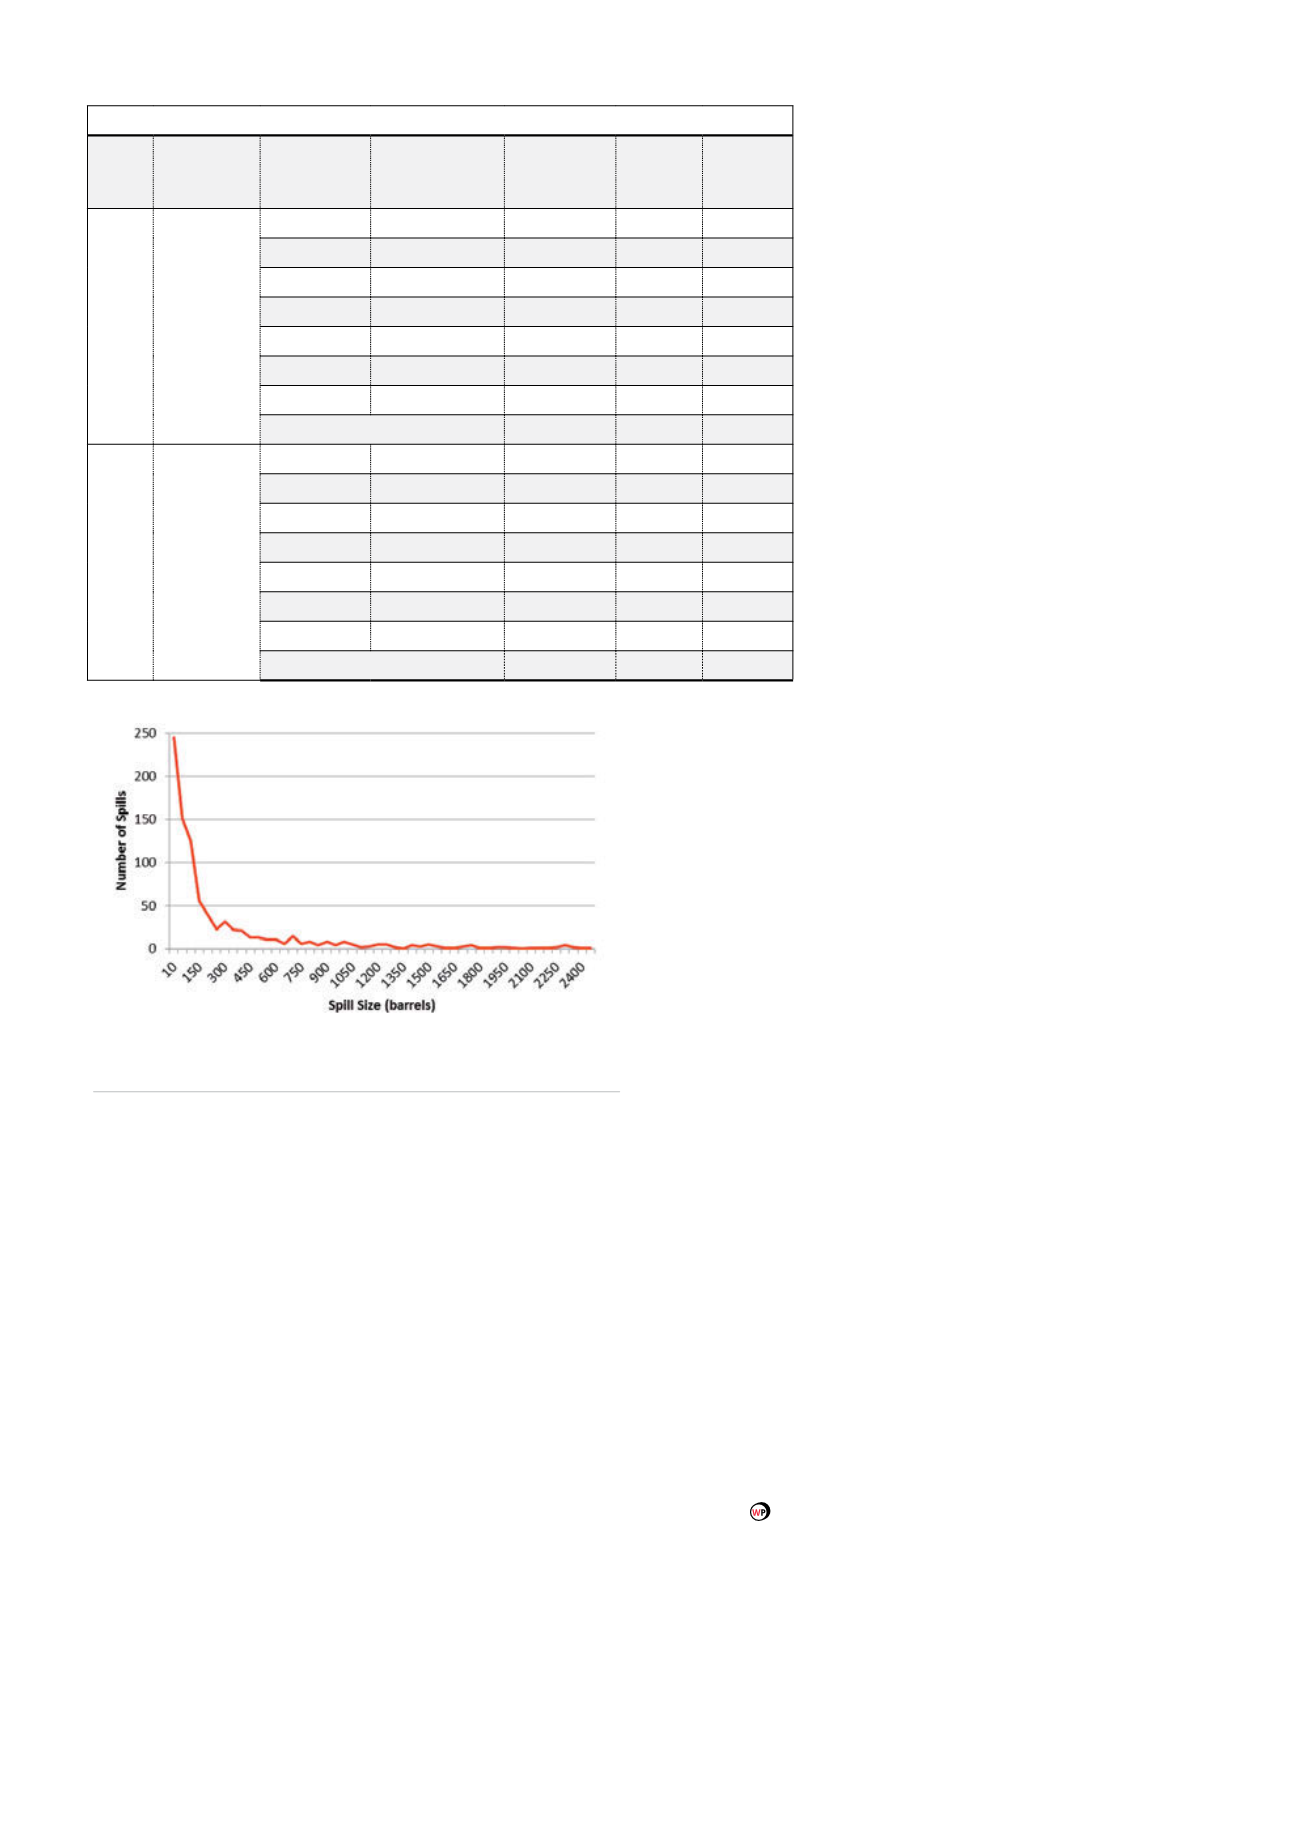
time. The PHMSA data discussed earlier also
seems to support this indirectly through
its distribution of total spill amounts as
presented in Figure 6.
The pipeline aerial surveillance frequency
for the realSens technology is driven
primarily by the goal to reduce the volume
of product that can be released due to a leak
caused by a pinhole. As established earlier, a
SCADA/CPM system will typically be capable
of alarming leaks down to about 1% of the
pipeline flow. For a 100 000 bpd pipeline
operating at 5000 kPa, this would correspond
to a significant 1000 bpd leak rate originating
from a 6 mm dia. hole.
The lower end hydrocarbon leak rate sensitivity threshold
for Synodon’s technology is around 4.5 bpd. The hole size
that would result in a leak of this magnitude from the pipeline
conditions presented above is 0.4 mm.
Let us consider two surveillance intervals for this analysis:
30 days and 90 days. Since the likelihood of a leak developing
is randomly distributed over these intervals, we can use the
midway point for a typical case analysis and the entire interval
as the worst case scenario. Table 1 lists the largest spill amount
that a leak caused by a 0.4 mm hole would be limited to by
using realSens.
Other holes sizes can develop in the pipeline than the
smallest one detectable by Synodon’s system and in general,
the leak rate increases with the square of the defect radius.
At the same time however, the likelihood of larger holes
developing decreases linearly with the radius. To illustrate this,
the numbers in Table 2 have been calculated for a 0.8 mm
defect using the same assumptions as presented in Table 1.
From Andy Bolsover et al, we can extrapolate that the
likelihood of a 0.8 mm defect developing in the pipeline is
roughly half (50%) that for a 0.4 mm hole.
3
Conclusion
The limitations of the existing SCADA/CPM systems highlight
the need to enhance the detection of leaks below 1000 bpd.
Synodon has demonstrated its realSens technology’s ability at
detecting these small leaks down to approximately 4.5 bpd.
Given this new capability, a pipeline operator can determine
the optimal surveillance frequency based on their unique risk
profile and desire to limit the maximum size of a potential
release.
References
1.
US Department of Transportation (DOT),
Pipeline and Hazardous Materials
Safety Administration (PHMSA)
: Leak Detection Study – DTPH56-11-D-000001.
2.
API Standard 1160: ‘Managing System Integrity for Hazardous Liquid Pipelines’,
First Edition, November 2001.
3.
BOLSOVER, Andy, et al (2013), A Public Leak Frequency Dataset for Upstream and
Downstream Quantitative Risk Assessment.
Figure 6.
Distribution of US spill sizes, significant leaks,
2002 - 2009.
Table 3. Detection results summary
Series N
2
flowrate
(scfh)
Pass no.
Mass (kg)
OSA
evaporation
rate (g/min)
Wind
direction
Detection
1
250
0
28.30
-
-
-
1
28.28
20
NNW missed
2
28.26
20
N
no
3
28.22
40
NNE
yes
4
28.18
40
NNE
yes
5
28.16
20
W yes
6
28.12
40
SW no
Average OSA evaporation rate: 30
-
-
2
500
0
28.84
-
-
-
1
28.78
60
S
weak
2
28.7
80
S
missed
3
28.64
60
SW yes
4
28.6
40
SSW yes
5
28.56
40
S
yes
6
28.52
40
SE
yes
Average OSA evaporation rate: 55
-
-
30
World Pipelines
/
JANUARY 2015


