experience and dissatisfaction with semi-quantitative
risk models. QPRAM is modular and flexible so it can
be readily configured to meet an operator’s specific
requirements and is implemented in the Rosen Asset
Integrity Management Software (ROAIMS) suite.
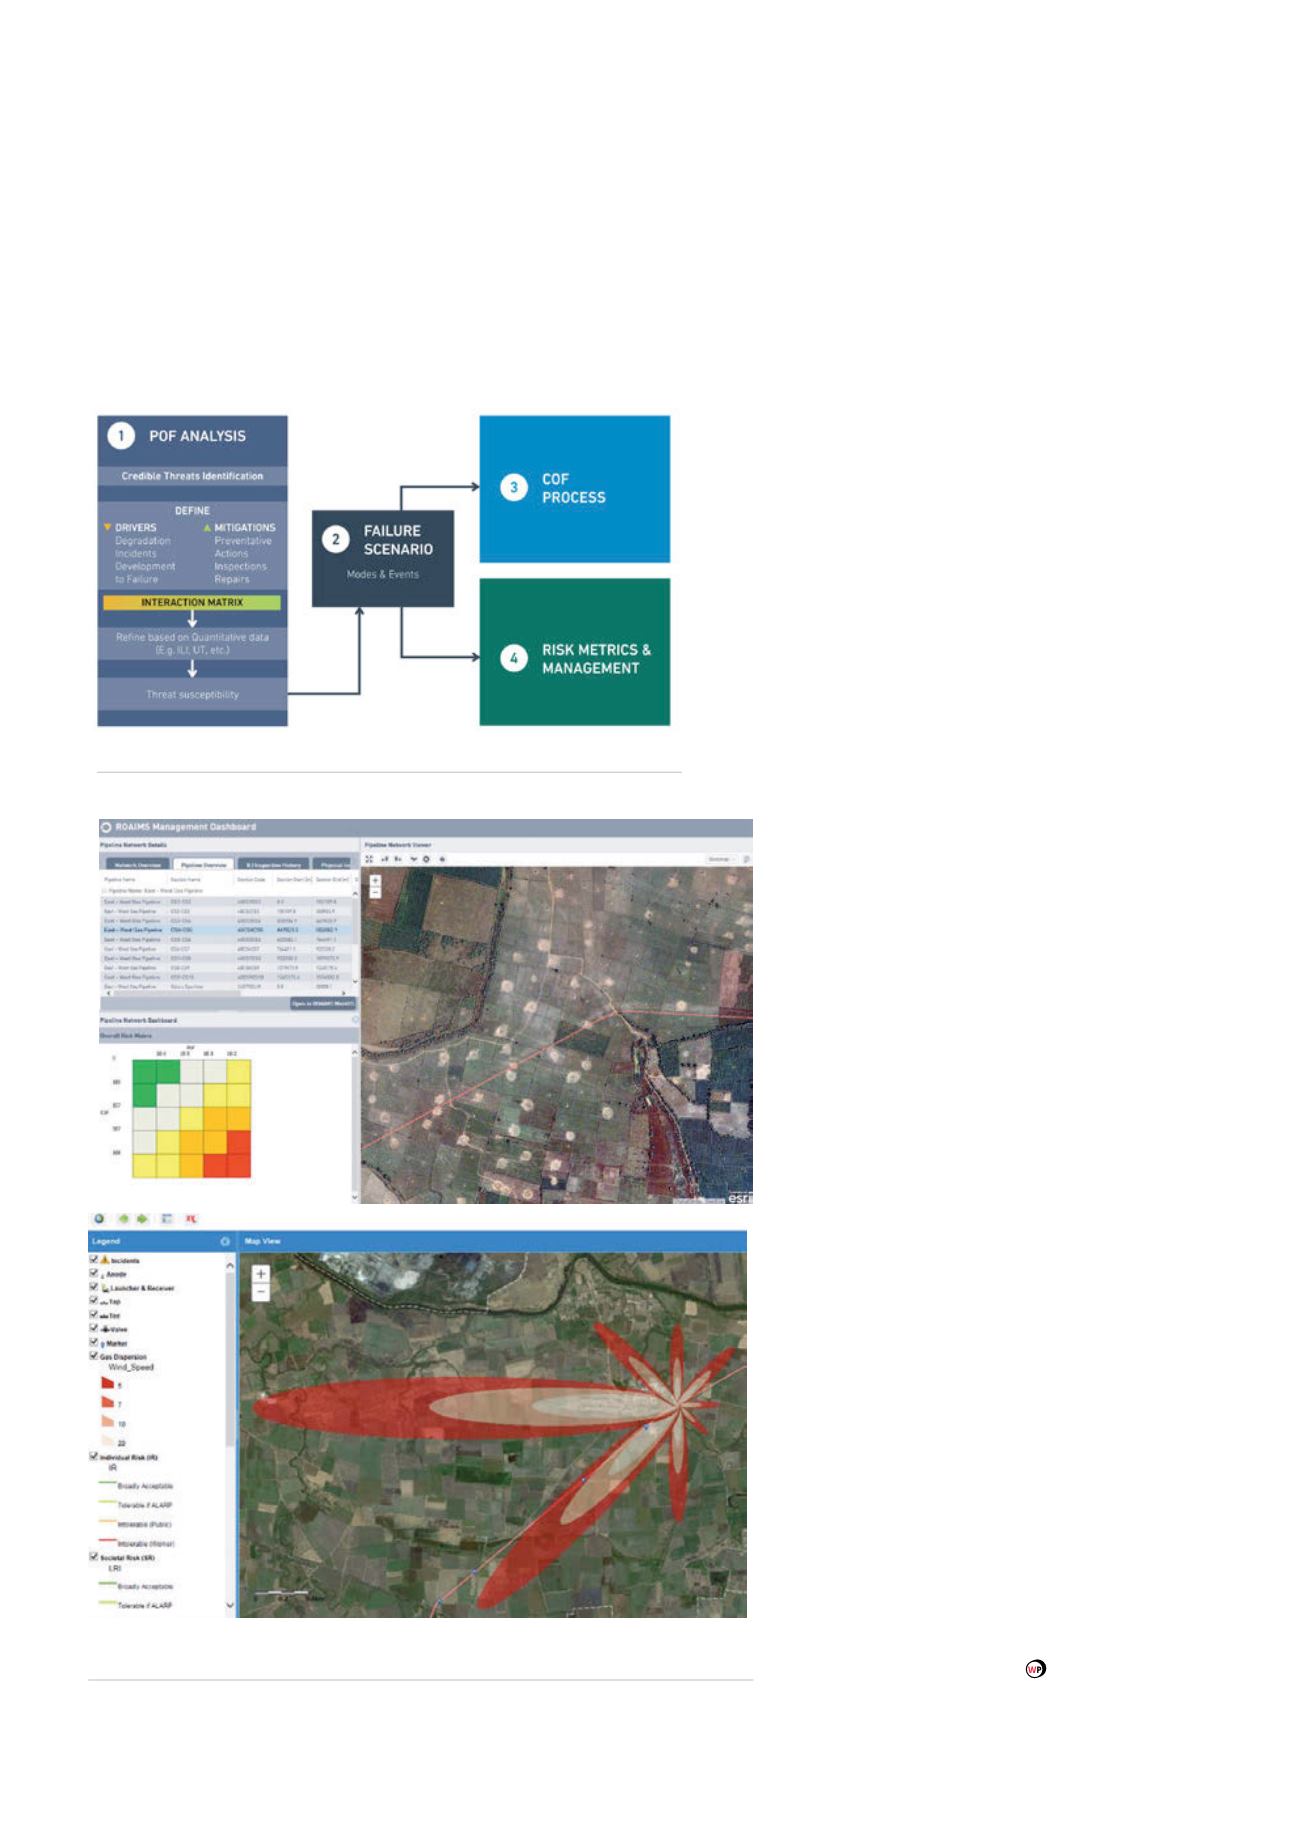
As well as generating numerical values for risk metrics,
QPRAM differs from previous models in that it delivers a
matrix of risk results at fixed interval along a pipeline, e.g.
every metre, 10 m or 5 km, as required for risk reporting.
In addition to readily identifying high risk areas, this
level of detail enables a range of KPI’s to be created, e.g.
measures of risk reduction arising from various mitigation
actions. The facility to carry out cost-benefit analyses of
different IMR strategies along a pipeline helps operators
focus their budget expenditure. Furthermore, analysis of
the risk results matrix in QPRAM identifies those pipelines
at greatest risk in a network and enables a ranking of
those pipelines for future IMR activities.
Pipeline risk factors are not fixed but represent
a snapshot at a particular point in time. Hence it is
essential to undertake a review of pipeline risks on
a regular basis to capture any changes in pipeline
operation or incorporate new inspection results.
Regular updates are also necessary to demonstrate to
regulatory authorities that an operator is maintaining
the integrity of his pipeline network. This is essential
to meet the growing need to extend the service life
of ageing capital assets like pipelines. Rosen Integrity
Solutions provides wide ranging technical support to
its clients in the form of risk specialists to assist with
reviewing risk levels, pipeline integrity expertise to
interpret risk results and corrosion experts to help
understand the cause of any high risk levels.
Meeting operators’ challenges
The QPRAM methodology is based on accepted
international codes and industry best practices.
It has a modular structure to accommodate
improved numerical data such as ILI runs, data
from geospatial layers and increasing levels of
model complexity. QPRAM is also flexible so
it can be readily configured to meet a broad
range of applications including onshore and
offshore pipeline networks transporting a wide
range of gas and liquid products.
QPRAM continues to be developed in
response to operator requirements. Recent
examples that have benefitted from the
introduction of automated GIS processing
methods include:
)
)
Identification of high consequence areas
and societal risk calculations.
)
)
Dispersion model for both onshore gas
releases and subsea oil releases.
)
)
Lethality model for toxic gas (H
2
S) releases.
)
)
Explosion model for gas build up in
confined spaces.
QPRAM has been provided to clients around
the world including Europe, Asia Pacific, India,
Middle East, South America and North America.
These clients operate a wide range of pipelines
from offshore crude export lines to onshore
gas transmission networks.
Figure 4.
GIS tools developed to model dispersion and assess consequences of
failure.
Figure 3.
Risk assessment structure.
46
World Pipelines
/
JUNE 2015


