no active corrosion would correspond to the behaviour of steel in
quiet seawater, rather than in soil; and the worst-case rates in low
resistivity soil are greater than those in moving seawater.
USDOT and NBS
In USDOT Publication No. FHWA-NHI-00-044, Corrosion
Degradation of Soil Reinforcements for Mechanically Stabilised
Earth Walls and Reinforced Soil Slopes
8
, Effect of Resistivity on
Corrosion, is presented here as Table 4. These classifications of
aggressiveness categories are similar to those used throughout
the corrosion control industry. In the original document, the
text immediately following this table states, “from the National
Bureau of Standards (NBS) data...a rough estimate can be made
that suggests corrosion rates are roughly increased by 25% in
each successive aggressiveness range, all other conditions being
essentially equal.” Accordingly, the values in the corrosion rate
column of Table 5 have been calculated, beginning with the
industry accepted definition that the corrosion rate in a ‘non
corrosive’ environment must be less than 1 mil/yr.
Comparison with the values presented in Table 1 suggests that
the ASME rates are excessively conservative. Again, the B31.8S
corrosion rate for high resistivity soil with no active corrosion is
greater than the calculated corrosion rate in the most aggressive
category from Table 5.
Summary
Accurate root cause analysis is critical for any metal loss observed
during direct examinations. Where the factors that contributed to
the metal loss have been or can be successfully mitigated (such as
by effective cathodic protection), substantial technical validation
exists to support the use of a corrosion rate no greater than 1 mil/
yr for estimating pit growth.
In the absence of documented compliance with SP0169, or
when other factors identified by root cause analysis have not been
adequately addressed, the guidelines of B31.8S may be used to
estimate corrosion growth rates.
The commonly-used guidelines for estimating corrosion
rates based on soil resistivity are excessively conservative and
are not adequately justified with supporting data. Where root
cause analysis identifies soil corrosion as the dominant corrosion
mechanism, B31.8S permits the use of other corrosion rates with
a sound technical basis. The calculated corrosion rates in Tables
3 and 5, based on the Peabody and DOT/NBS data, suggest that
a reasonable maximum corrosion rate in relatively uniform soils
would be approximately 2.5 mils/yr.
References
1.
SCHWERDTFEGER, W. J., and MCDORMAN, O.N., National Bureau of Standards,
‘Potential and Current Requirements for the Cathodic Protection of Steels in Soils’
Corrosion 8, 11, 1952.
2.
THOMPSON, N. G., and BARLO, T. J., ‘Fundamental Process of Cathodically Protecting
Steel Pipelines’, International Gas Research Conference, 1983.
3.
HOEY, G. R., and COHEN, M., ‘Cathodic Protection of Iron in the Temperature Range of
25-92˚C,’ Corrosion 14, 4, 1958.
4. BARLO, T.J., American Gas Association Interim Report, PR-151-163, ‘Field Testing the
Criteria for Cathodic Protection’, 1987.
5.
ZDUNEK, A.D., and BARLO, T.J., ‘Effect of Temperature on Cathodic Protection Criteria’
Materials Performance 31, 11, 1992.
6. DRAKE, J. A. et al, American Society of Mechanical Engineers, B31.8S ‘Supplement to
B31.8 on Managing System Integrity of Gas Pipelines, 2001.
7.
BIANCHETTI, R.L, et al, Peabody’s Control of Pipeline Corrosion by A.W. Peabody,
published by NACE Press, 2001.
8. ELIAS, V., USDOT Publication No. FHWA-NHI-00-044. ‘Corrosion Degradation of Soil
Reinforcements for Mechanically Stabilized Earth Walls and Reinforced Soil Slopes’,
2000.
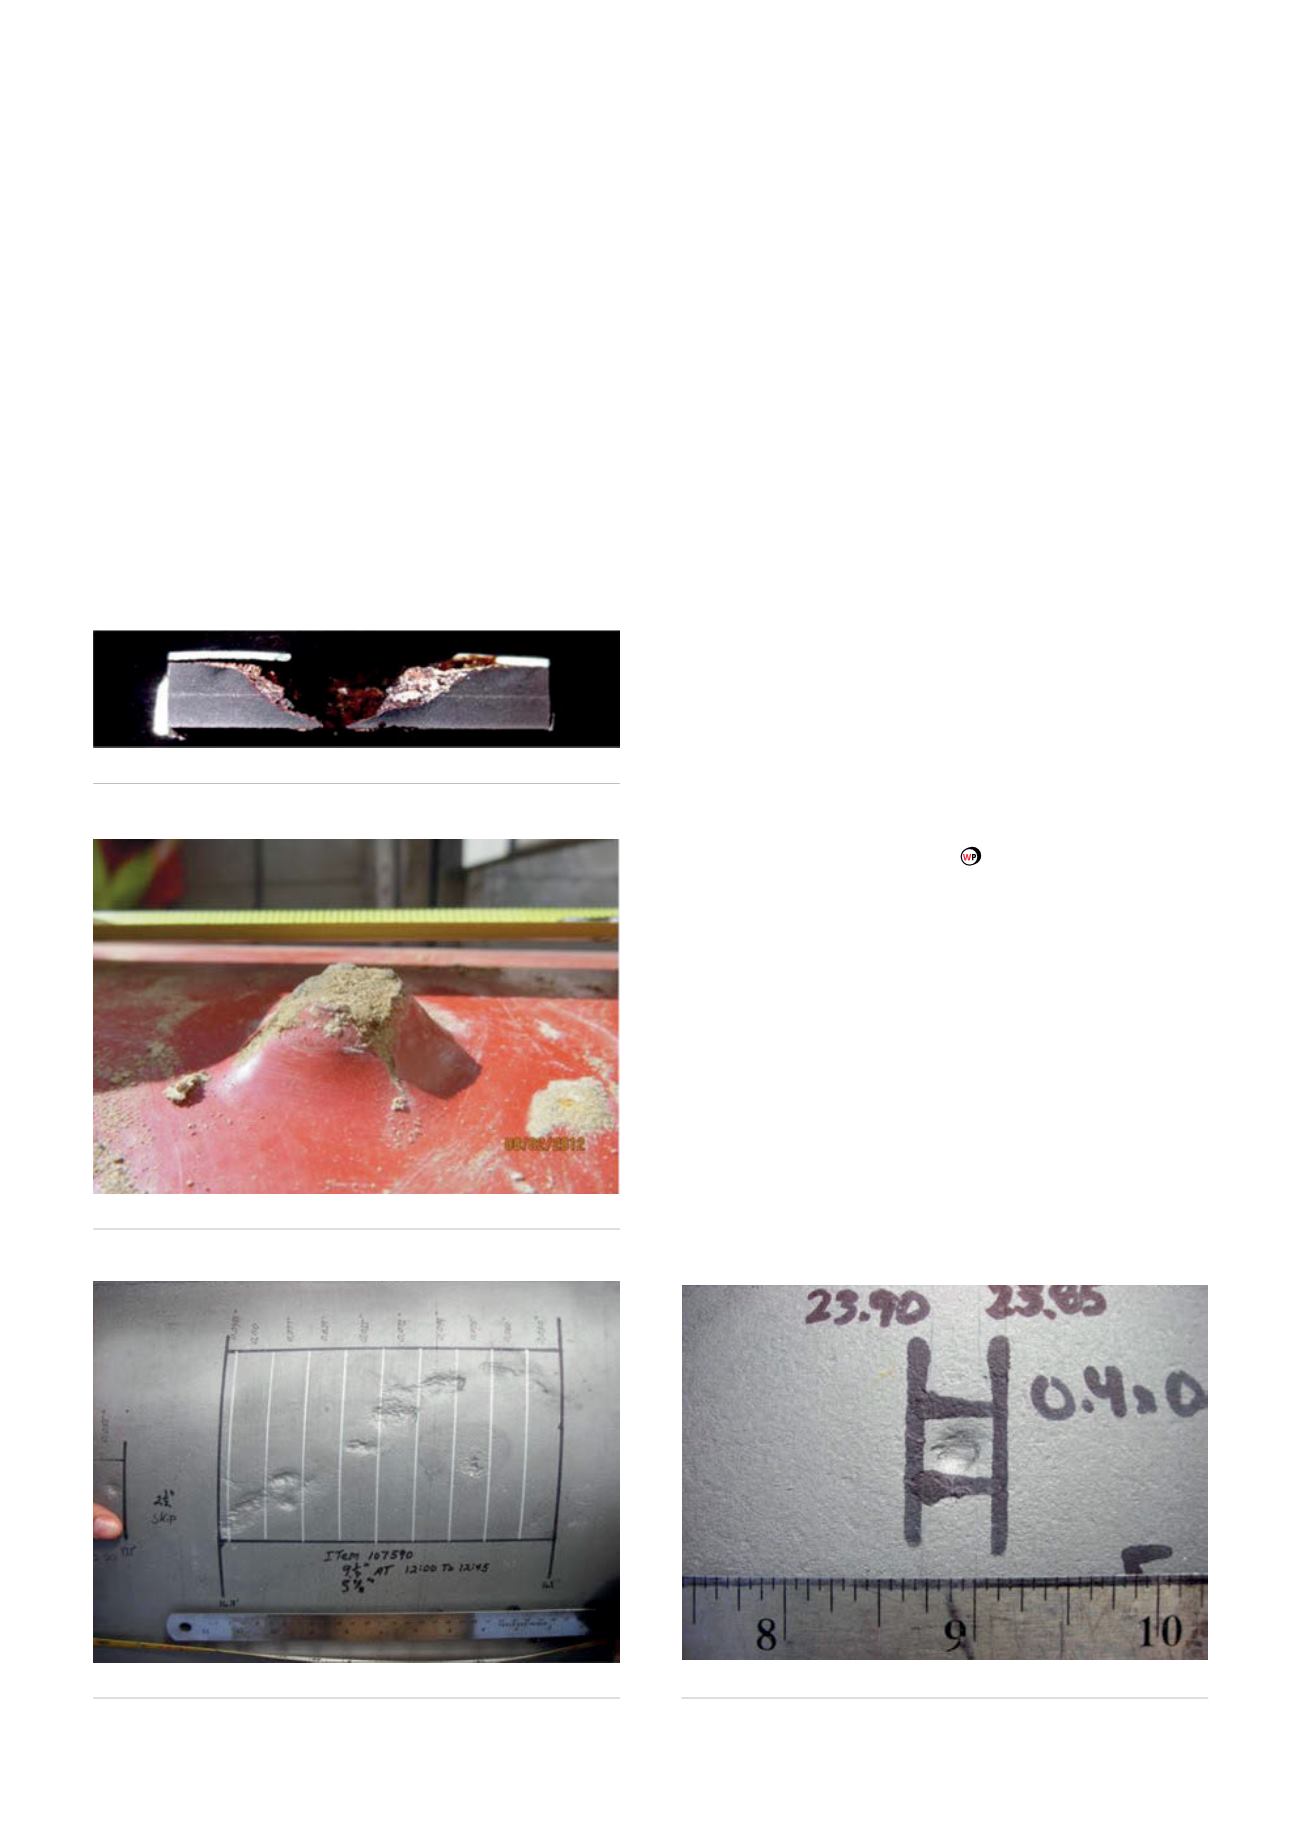
Figure 4.
D-C stray current FBE undercut.
Figure 5.
Non D-C stray current coating ‘lift-off’.
Figure 6.
Localised pitting corrosion.
Figure 7.
Localised pitting corrosion.
118
World Pipelines
/
AUGUST 2015


