)
)
Hoey and Cohen
3
: “the corrosion rate is not reduced to
negligible values, although nominally near 1 mil/yr over
temperatures from 75 - 198˚F.”
)
)
AGA’s Interim Report
4
: Includes “polarised potential…to obtain
a corrosion rate of 1 mil/yr”; and, at the bottom of Page ES-2,
“regarding the criteria, assuming protection has been achieved
with a corrosion rate of 1 mil/yr.”
100 mV of cathodic polarisation
This research adopted the same definition of effective CP. Some
of the more significant examples follow:
)
)
AGA’s five year study on polarisation of coupons
4
: “the general
corrosion rates were typically less than…1 mil/yr.”
)
)
Zdunek and Barlo
5
: “…found that the amount of polarisation
required to reduce the corrosion rate to (1 mil/yr)” and the
plot of the “effect of temperature on the level of polarisation
for (1 mil/yr) corrosion rate.”
Therefore, if effective CP can be demonstrated throughout a
pipeline segment by close interval potential survey (CIS), coupon
data, or other means, then it is appropriate to use a growth rate of
1 mil/yr going forward. It is required that the contributing factors
to the observed metal loss have been identified during root cause
analysis and effectively mitigated. The projected corrosion rates
may also be applied to locations that have not been directly
examined, but which are subject to the same influences.
It is important to note that achieving the 1 mil/yr growth
rate expected with effective CP might not be the appropriate
objective for all pipelines. Factors such as the condition, critical
function, age, and intended service life of a specific pipeline
will affect the corrosion rate that can be tolerated and must be
considered.
Locations with ineffective CP
Where effective CP cannot be established but the corrosivity
of the soil environment may be adequately represented by
its resistivity, alternative methods must be used to estimate
corrosion rates. ASME’s B31.8S is among the most commonly used
guidelines for estimating corrosion rates based on soil resistivity.
ASME B31.8S
The text of ASME B31.8S
6
states that environmental characteristics
such as soil resistivity should be measured during direct
examinations. This document further states that this data “can be
used to estimate corrosion rates” (Table 1).
However, no technical support for these values is offered;
and there is no reference to the source of this table. Immediately
following the table, it is stated that, “If the operator can provide a
sound technical basis for using other corrosion rates or estimates
based (on) direct examination measurements, the actual rate can
be used in-lieu of those shown in the above table.” Furthermore, it
appears unreasonable to assign a corrosion rate as great as 3 mil/
yr to a site where soil corrosivity would typically be classified as
non-corrosive (no active corrosion).
NACE International
Peabody’s Control of Pipeline Corrosion
7
includes Table 2. The
consumption rate of pipeline steel is 20 lb per ampere-year. Based
on a density of 7.89 g/cm
3
, the corrosion rate conversion factor
is 1 microampere/cm
2
= 0.454 mil/yr. It is reasonable to assume
that the range of protective current requirements must be at least
as large as the anticipated corrosion currents for the conditions
described. Therefore, the corresponding corrosion rates have been
calculated (Table 3).
Comparison with the values presented in Table SP-B1 from
B31.8S (Table 1) suggests that the ASME rates are excessively
conservative. The B31.8S corrosion rate for high resistivity soil with
Table 3. Estimated current requirements for CP of steel and
corrosion rates (adapted from Peabody, p. 499)
7
Conditions affecting
bare steel
Protective current
required (mA/m2)
Corrosion rate (mil/
yr)
In moving seawater
100 - 160
4.54 - 7.264
In quiet seawater
55 - 85
2.497 - 3.859
In earth
10 - 30
0.454 - 1.362
Table 4. Effect of resistivity on corrosion (excerpted from
FHWA-NHI -00-044, p. 9)
8
Aggressiveness
Resistivity (OHM-CM)
Very corrosive
<
700
Corrosive
7000 - 2000
Moderately corrosive
2000 - 5000
Mildly corrosive
5000 - 10 000
Non corrosive
>
10 000
Table 5. Effect of resistivity on corrosion (adapted from FHWA-
NHI -00-044, p. 9)
8
Aggressiveness
Resistivity (OHM-CM)
Corrosion rate
(mil/yr)
Very corrosive
<
700
<
2.43
Corrosive
7000 - 2000
<
1.95
Moderately corrosive 2000 - 5000
<
1.56
Mildly corrosive
5000 - 10 000
<
1.25
Non corrosive
>
10 000
1
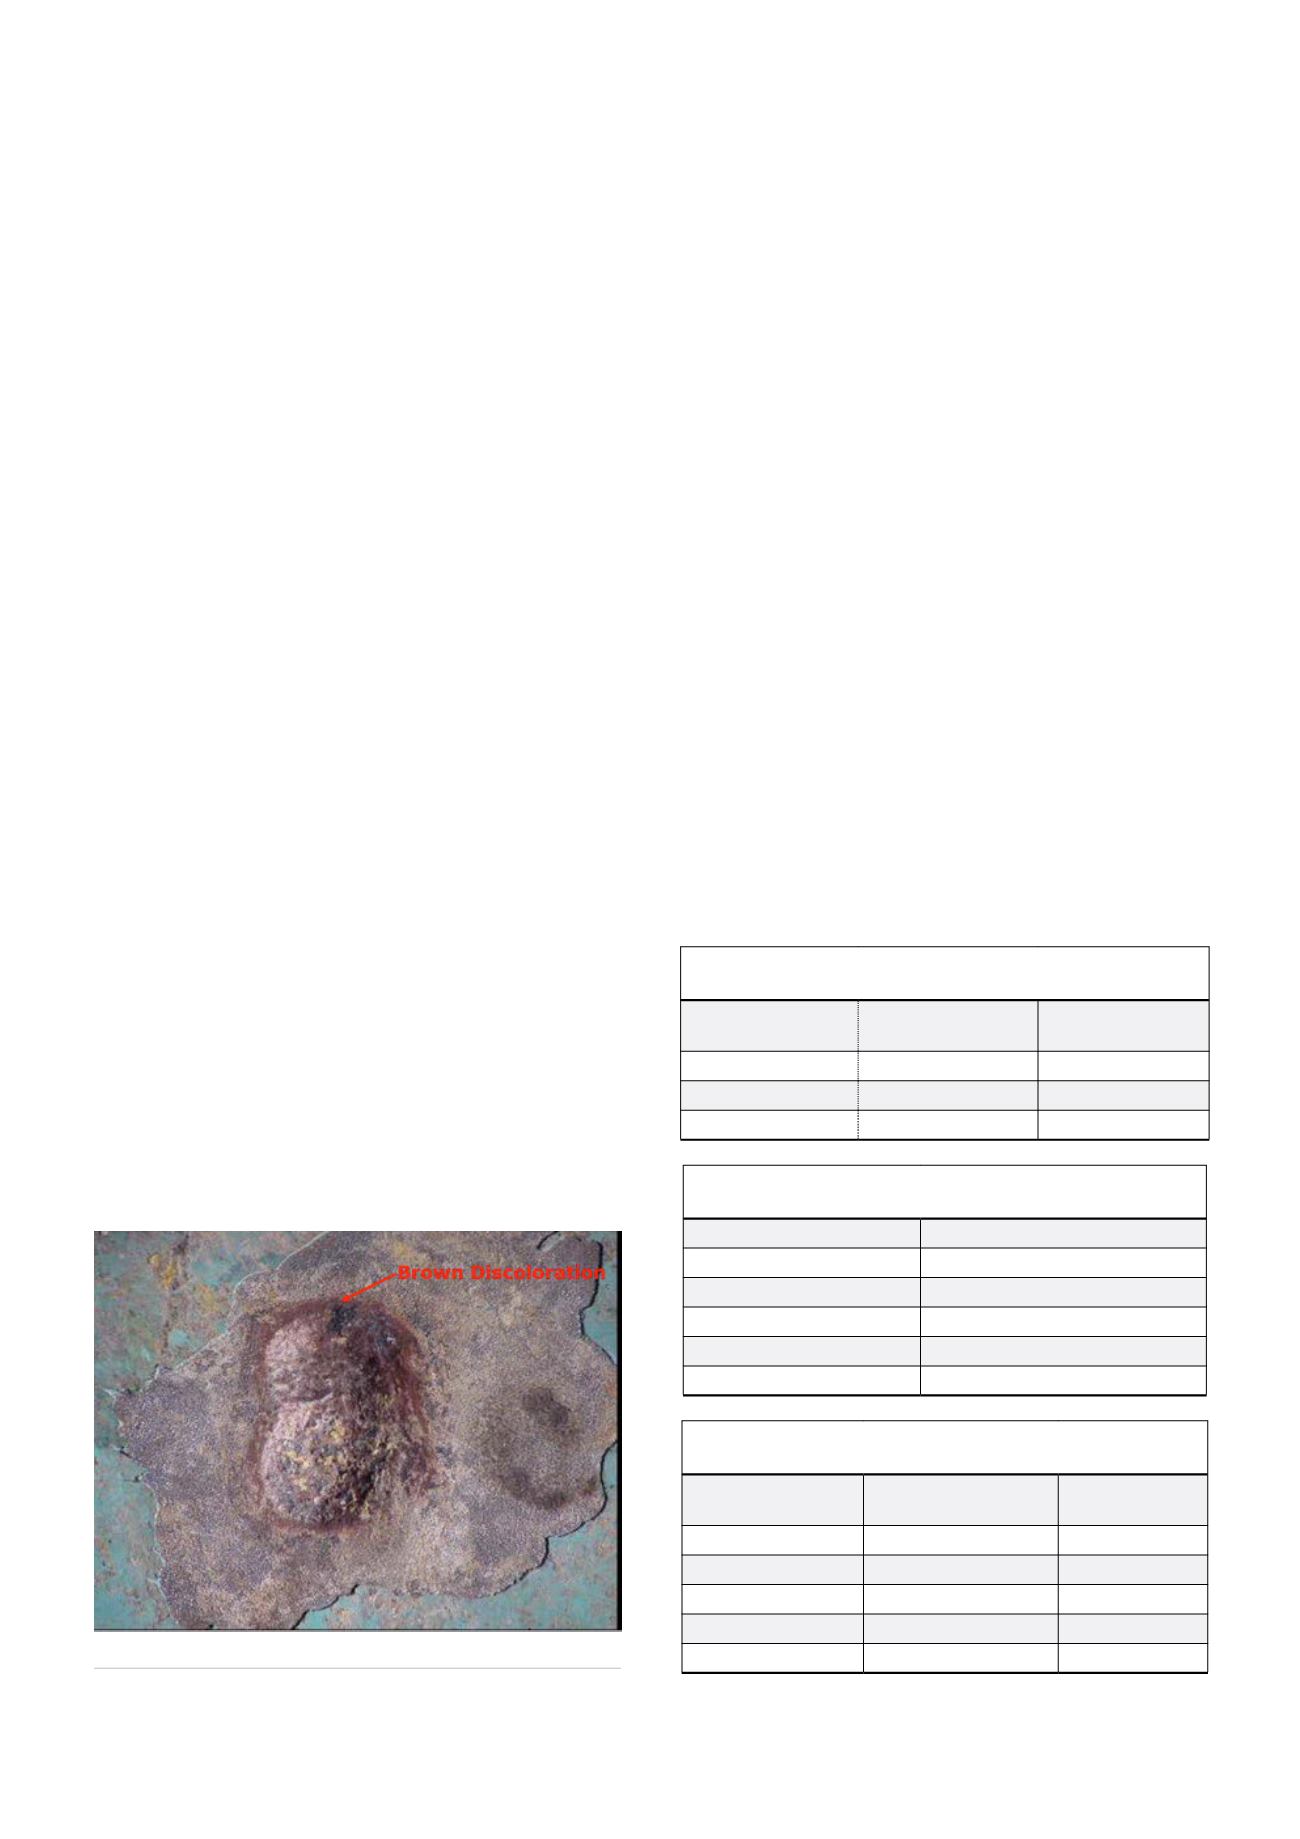
Figure 3.
A-C stray current corrosion.
116
World Pipelines
/
AUGUST 2015


