May
2015
Oilfield Technology
|
25
compared to their interaction with similar structures not containing
hydrocarbons.
Passive seismic spectroscopy quantifies and analyses within a
low frequency range particular alterations of the seismic background
noise using different types of data analysis methodologies with the
objective to insulate all these spectral characteristics and quantify
them in terms of seismic energy contained within that particular
insulated characteristic.
For each acquisition passive seismic station the local seismic
energy, which is directly related to the potential existing reservoir, is
gathered.
Data interpolation, integration and interpretation gives a
final result of the distribution of all the seismic energies all over
the surveyed area and shows the result in an iso-seismic energy
distribution map, which gives the distribution potential presence of a
hydrocarbon reservoir.
Instruments, stations,dataacquisition
Data acquisition is carried out in passive modality without any
external vibrational or impulsive sources of noise.
During the IPSS survey, all the passive seismic stations are
pure mobile seismic stations and all the instruments used for the
acquisitions are seismometers and are used in the GSN for earthquake
monitoring purposes.
The data acquisition will be done using seismic stations acquiring
the natural background seismic noise. In order to obtain reliable
iso-energy distribution maps all the stations will uniformly cover the
surveyed area.
Seismometers are placed inside holes ~50 cm in depth with a
diameter of ~40 - 45 as shown in Figure 8. The seismometers have to
be placed in the holes and well coupled vertically and transversally.
For the IPSS the setup has to be done in run of 5 – 10 seismometers
and the acquisition as to be done during the night.
For the microseismic survey, all the station will acquire
continuously night and day for 15 nights.
Casestudy:passiveseismic resultsBlock2A-Kenya
The low frequency seismic energy distribution is shown in Figure 7
below:
Ì
Ì
‘Passive Seismic Potential I’ (Pot. I) (~29 km
2
), centred at ~11 km
southeastern part of Wajir.
Ì
Ì
‘Passive Seismic Potential II’ (Pot. II) (~140 km
2
), centred at
~18 km South of Wajir.
Ì
Ì
‘Passive Seismic Potential III’ (Pot. III) (~164 km
2
), centred at
~40 km South of Wajir.
Basement timestructuralmapversuspassiveseismic
From the ‘Basement Time Structure Map’ (TWT), it is possible to
observe three main structural anomalies located within the block.
Based on the TWT map, three main structural prospects have been
localised and are located as follows:
Ì
Ì
Structural Prospect P-1: located in the south-eastern part of Wajir.
Ì
Ì
Structural Prospect P-2: located in the south-south-eastern part
of ‘Passive Seismic Survey Area #1’.
Ì
Ì
Structural Prospect P-3: located nearer the centre of the Block 2A.
The TWT distribution map above gives a clear picture where
Hydrocarbon Potential could be located. The main Structural
Prospect (P-1) has a TWT between ~2600 and 3000 ms. The second
main structural prospect (P-2), located within the southeastern part
of Passive Seismic Survey Area #1 has a TWT of 3000 ms. The third
structural prospect (P-3) is located within the central part of ‘Passive
Seismic Survey Area #2’, with a TWT of 3250 ms.
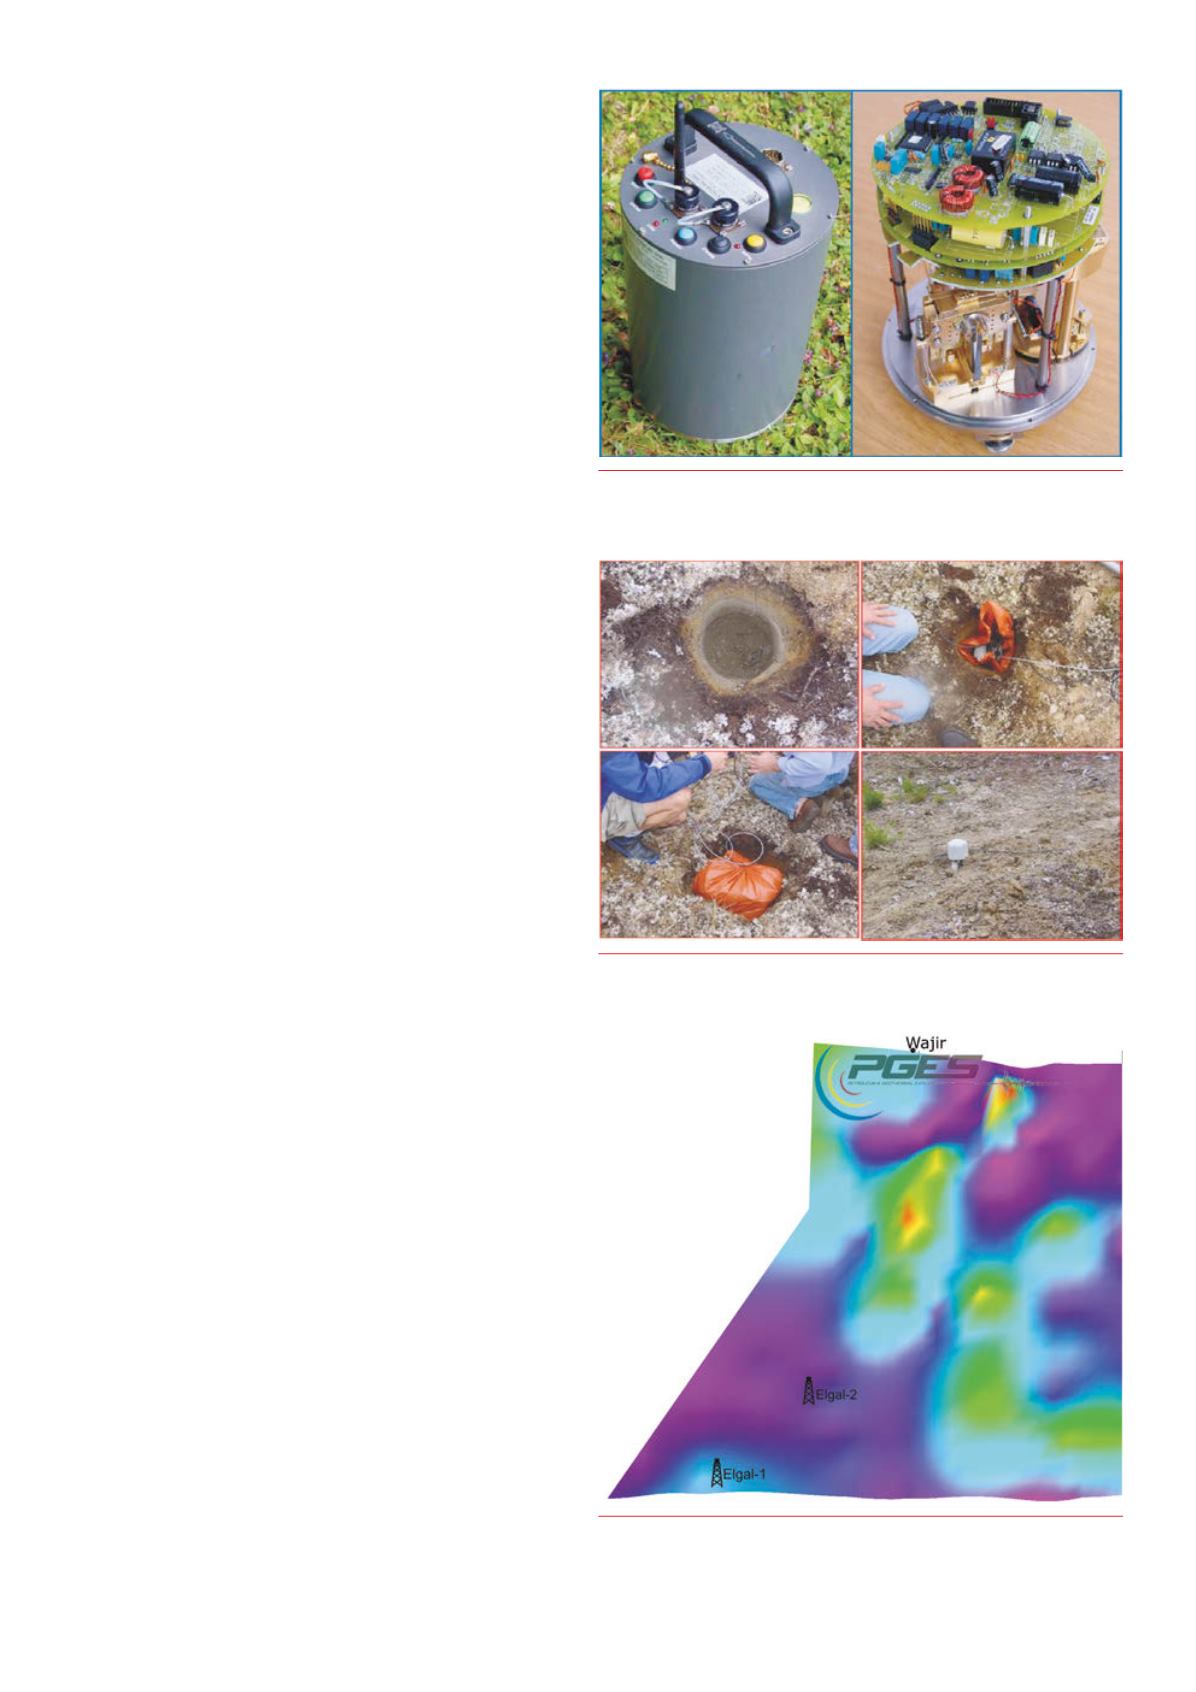
Figure 4.
3DSeismometer GuralpCMG-3EX-EAMwitha 24 bit digitiser
andGPS receiver built in. The storage system is integratedaswell. These
instrumentswill measure the background seismic noise.
Figure 5.
Sequence of installation of a typical passive seismic station usinga
GuralpCMG-3EX.
Figure 6.
Hydrocarbon seismic energy distribution over the acquisitionarea
withinBlock 2A.


