26 |
Oilfield Technology
May
2015
Full tensorgravity (FTG) versuspassiveseismicover
Block2A
Most recently a Full Tensor Gravity (FTG) gradiometry study has been
conducted over Block 2A which appears to be in strong agreement
with the main identified ‘Passive Seismic Potential Anomalies’ Pot. I,
II, III, VII.
Within the primary coverage area, the FTG has identified
structural features with independent closures varying in size from
30 km
2
to >100 km
2
. The largest, having 2D seismic 4 way structural
(M#1, M#2, M#3 and M#4) closures with excellent agreement to FTG and
earlier passive seismic surveys, is seemingly an excellent prospect area.
Seismic/FTG/passiveseismic/TWT
The original undertaking was to investigate and ascertain the
hydrocarbon potential at the three initial structural targets/prospects
(P-1, P-2, P-3) by first employing a block survey using ‘Passive Seismic’
to confirm or identify areas of hydrocarbon potential to be followed
up then with 2D seismic for independent confirmation and structural
definition.
‘Passive Seismic Potential I’ holds the ‘highest energy levels’
recorded across the area and represents the strongest hydrocarbon
prospect within the entire acquisition block. It is centred at ~11 km
southeast fromWajir and has an extension of ~29 km
2
.
‘Passive Seismic Potential I’ overlapped with the depth related
‘Structural Basement Time Map’ shows the exceptional agreement
in results, matching ‘Structural Prospect P-1’ with ‘Passive Seismic
Potential I’.
‘Passive Seismic Potential I’ is over ‘Structure
P-1’which appears with a TWT of 2750 mS
confirming the possible hydrocarbon potential of
the structure.
The ‘Seismic Line VTU-01’ is one of two
seismic lines that pass through Structural
Prospect P-1; VTU-01 also passes through part of
‘Passive Seismic Potential I’.
Starting from the shot point 300 up to the
shot point 650 it is possible to see how ‘Passive
Seismic Potential I’ is located in the middle of the
Lead-1 identified by the seismic line VTU-01
Overlapping the FTG distribution over the
‘Structural Prospect P-1’ and ‘Passive Seismic
Potential I’ it is possible to see how the Full
Tensor Gravity is also in line with the Passive
Seismic results via M#1 and therefore also the
‘Structural Basement Time Map’.
All 4 methodologies seem to agree via (P-1
from VTU-01, Pot.I and M#1).
Referring to Seismic Line K74-2 and the
‘Hydrocarbon Seismic Energy’ along it, ‘Passive
Seismic Potential II’ and FTG Closure’s M#2 and
M#3 appear to be located between shot points
1700 and 1900 with a main peak in energy
levels localised quite specifically between
shot 1750 - 1780.
Conclusion
PGES’s passive seismic IPSS/IPDS together with
FTG and seismic identified the most prominent
potential areas within the surveyed block over
the Mandera basin.
The client has pointed out areas, through the
analysis of gravity and seismic data, with three
structural leads.
The main goal of the survey was the
evaluation of the presence of hydrocarbon
potential of the seismic prospects and FTG
closures, in order to reduce the exploration risk in
some areas of the block.
Figure 7.
TWTMap overlappedwithBlock 2A over a satellite view. Structural
prospects are identifiedand visible as threemain Structural Prospects P-1,
P-2 andP-3.
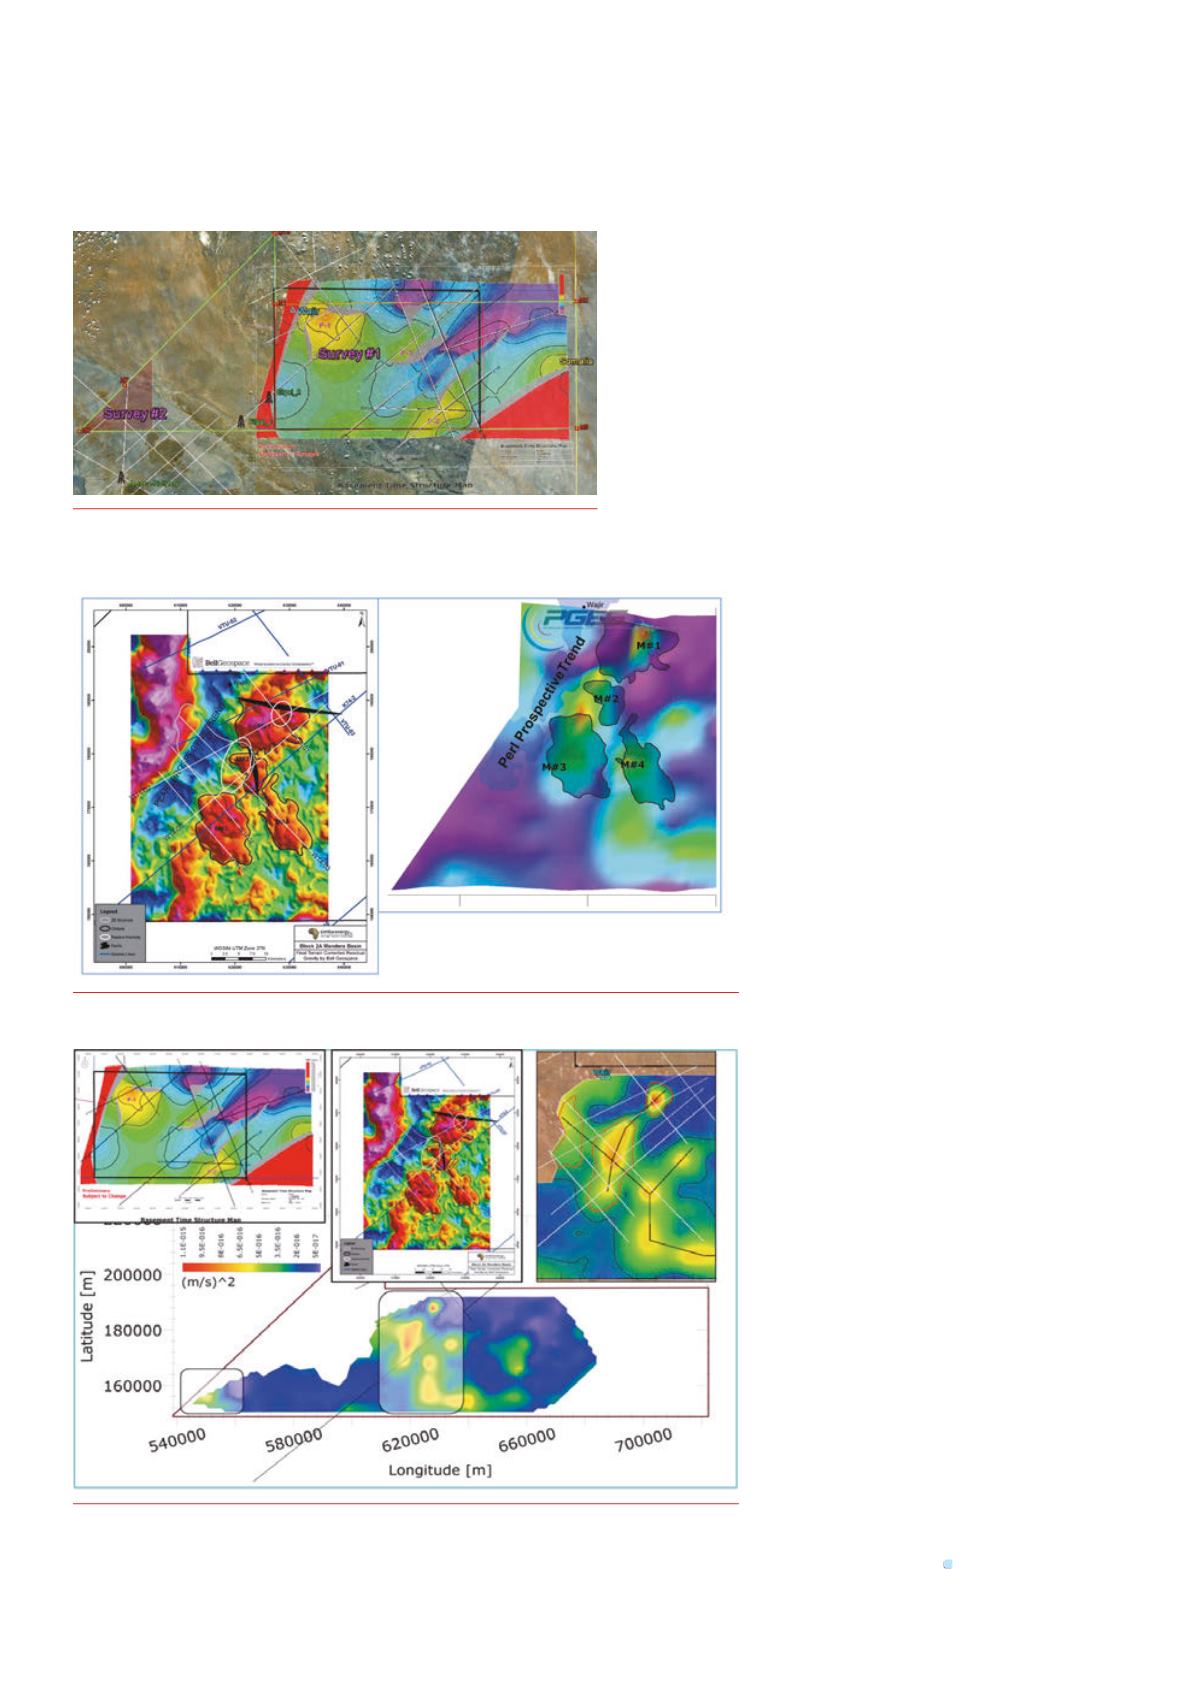
Figure 8.
FTGdistribution over themain central area of interest at Block 2A (left) andpassive
seismic distribution (right) with the FTG closures.
Figure 9.
FTGdistribution (top-centre), ‘Basement Structural Map’ (top-left), Passive Seismic
Distributionwithin the central area of Block2A (top-right), Passive Seismic Distribution over the
entire acquisitionareawithinBlock 2A.


