18 |
Oilfield Technology
June
2015
Yet structural modelling faces a variety of challenges. These
include more geologically complex reservoirs that often come with
poor quality data and the inability of today’s interpretation solutions
to create a spatially accurate analysis of the field.
Other challenges include difficulties in inputting the inherent
uncertainty of oil and gas fields directly into the interpretation and
structural model for quantified risk analysis. Uncertainties in static
reservoir properties (spatial description and volumes) are often
difficult to quantify, particularly in frontier areas where there is little
well control.
At the seismic interpretation stage, there is also often inherent
ambiguity in the data – often being down to a number of factors, such as
limited seismic resolution, constraints on velocity for depth conversion,
or questionable seismic quality. The result is uncertainties in the seismic
interpretation and uncertainties in the volumes of the reservoir.
Finally, there are time‑consuming and often fragmented
workflows. Too often, this can put pressures on the asset team and
create a source of uncertainty in the field model.
Emerson Process Management is working to address these
challenges and limitations through a new workflow and set of
structural modelling tools based around its reservoir modelling
workflow, Roxar RMS.
The workflow and tools are able to capture uncertainty during
the seismic interpretation and model building process and integrate
fault and horizon uncertainty modelling with structural modelling and
3D gridding. This leads to increased operator confidence in drilling and
production decisions as well as improved oil and gas recovery. At a
time of lower oil prices, this is vital.
Theworkflowplatform
The main methodology behind this newworkflow involves a geologically
consistent structural model being created (and updated) every time the
interpreter makes a measurement of a subsurface feature. This workflow
is called ‘Model Driven Interpretation’ (Leahy & Skorstad).
Model driven interpretation consists of both the seismic
interpretation step and the capturing of uncertainty. It is based around
the notion that seismic interpretation used as input into the reservoir
model should not simply be a collection of mapped seismic events,
but also a description of the variability tolerated within the data and a
quantifying of the zone of ambiguity within seismic interpretation.
The interpretation is based on uncertainty information being
collected and paired with an interpreted geologic feature (horizon,
fault, etc.), creating an uncertainty envelope and thereby more
accurately representing the limitations of the data and the interpreter’s
vision for the geologic structure.
In this way, the fault and horizon surfaces created are the
interpretation where the interpretation is not merely a collection
of control points, but the integrated geological representation of a
structural model satisfying those measurements.
Rather than creating one model with thousands of individual
measurements, the new workflow can create as many models as
required by estimating uncertainty in the interpreter’s measurements.
The software can then generate statistically significant models based
on these probability distributions and provide immediate value to the
geoscientist.
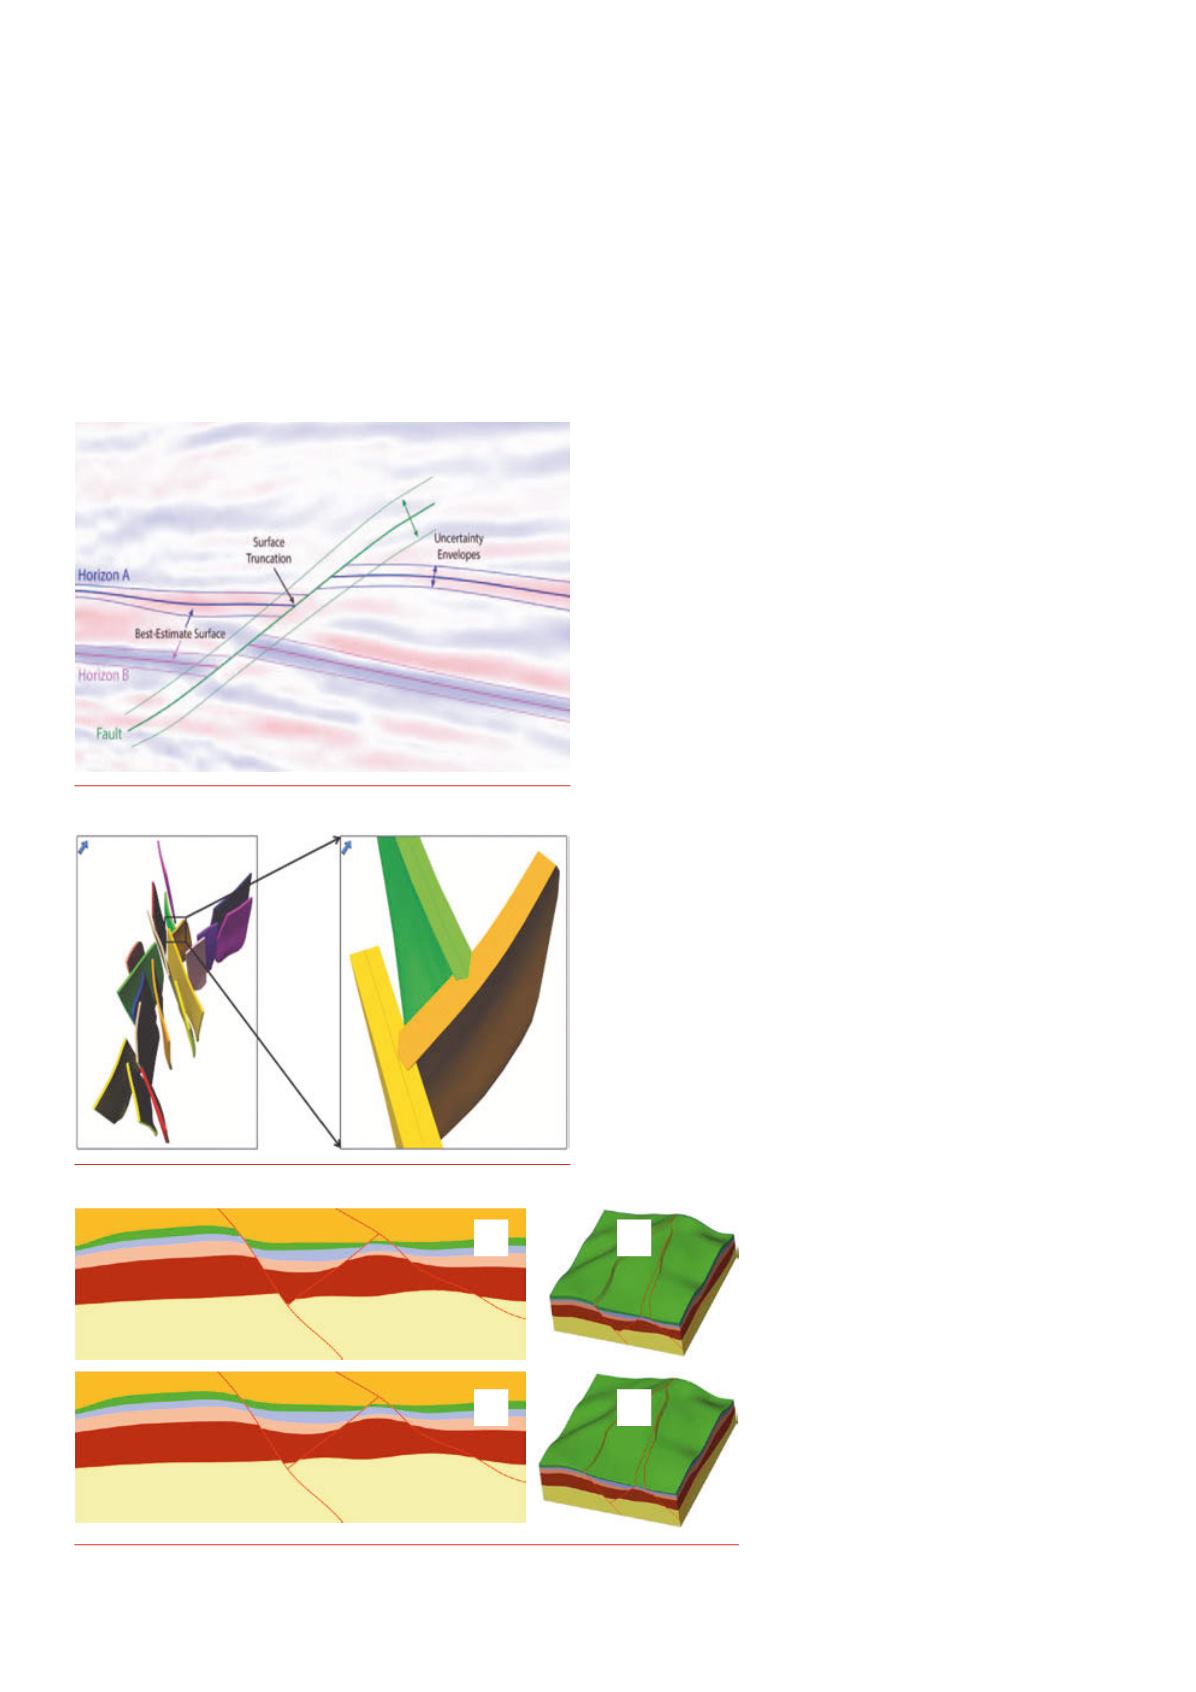
Figure 1 illustrates how measurement uncertainty is applied to a
simple seismic section where the interpreter measures a best estimate
surface and an associated uncertainty envelope.
In one offshore Middle East field, the operator
used the model driven interpretation workflow to
quantify gross rock volume (GRV) uncertainty – often
the most significant uncertainty especially in the
early phases of field appraisal and development.
Figure 2 illustrates the fault uncertainty envelopes
generated that were later developed into a grid, out
of which multiple realisations were generated and
eventually GRV ranges.
Faultandhorizonuncertainty
modelling
As part of the new workflow, fault and horizon
uncertainty models can also be built that
correspond directly to the uncertainty in the input
data. This was described by Emma Howley and
Randi Meyer
1
and is summarised here.
Figure 1.
Abestestimatesurfaceandanassociateduncertaintyenvelope.
Figure 2.
Fault uncertainty envelopes onaMiddle Eastern field.
Figure 3.
Changes in fault throwcreated through anautomaticworkflow (Georgsen et al. 2012).
a
b
c
d


